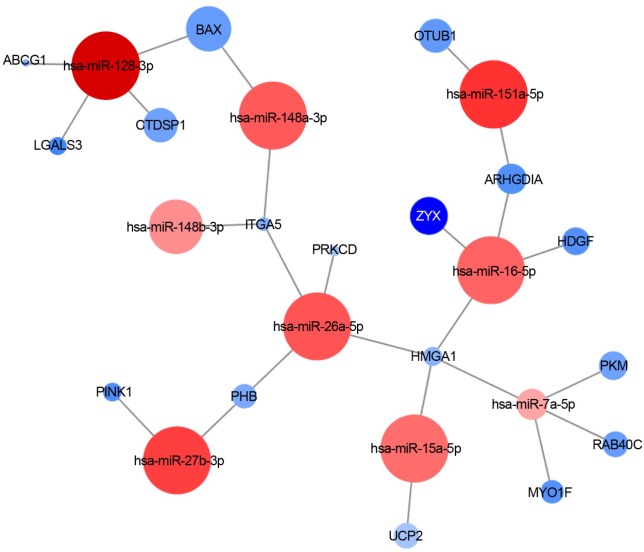
FIGURE 4.
miRNA-target interaction network. An example of experimentally validated miRNA-target gene interactions is visualized as a network (by Cytoscape 3.6.0). Nodes are colored according to the log2 fold change between sALS and HC (red: downregulated; blue: upregulated), and the node size is proportional to the p-value in the DE analysis.

