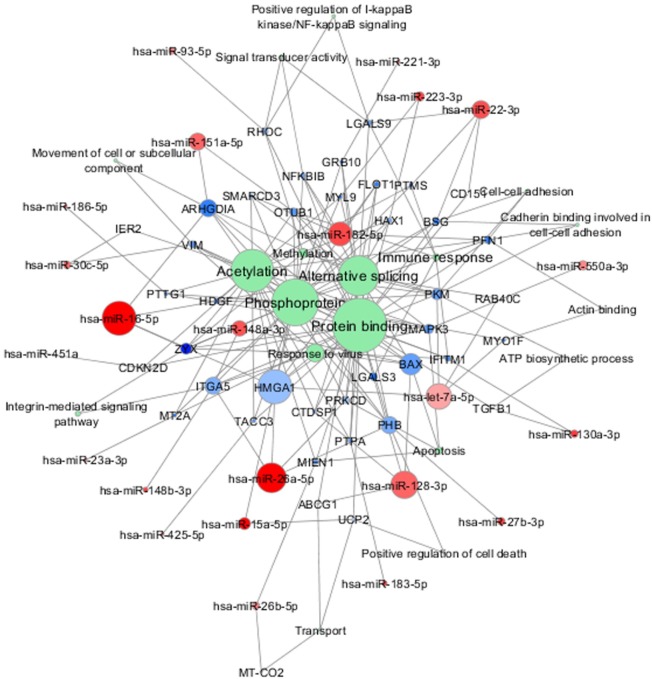
FIGURE 6.
Combined molecular analysis in sALS. Functional annotations of experimentally validated target genes together with their miRNAs are visualized as a network (Cytoscape 3.6.0). Each node size is proportional to the degree of the node (connectivity). Green nodes correspond to functional annotations obtained by functional enrichment analysis (DAVID tool). Color gradient intensity of miRNA and target nodes correlates with upregulated (blue) or downregulated (red) expression levels.

