
FIGURE 7.
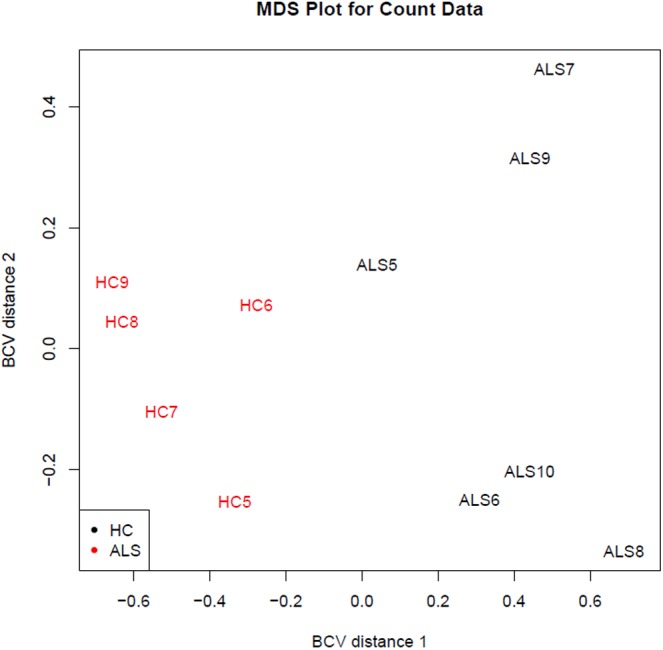
Distribution of the study samples by sRNA-seq output (discovery phase). The sRNA-Seq data were explored by generating multi-dimensional scaling (MDS) plots. This visualizes the differences between the expression profiles of different samples in two dimensions using the biological coefficient of variation (BCV). The MDS plot shows clear separation of the sALS vs. HC samples.