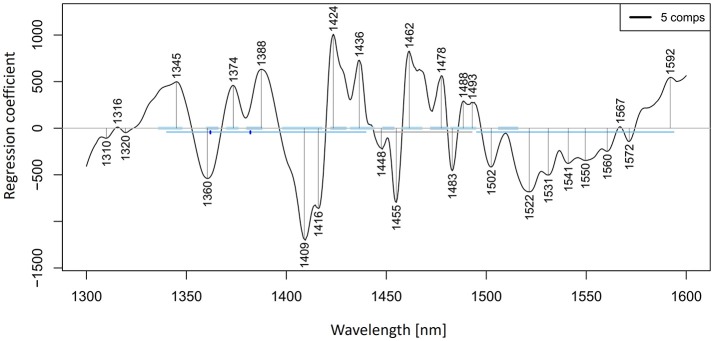
Figure 10.
PLSR analysis of Milli-Q water and aqueous solutions of potassium-chloride in the concentration range of 10–100 mM derived from the smoothed (calculated with a Savitzky-Golay filter using 2nd order polynomial and 21 points) and MSC transformed absorbance (logT-1) spectra in the spectral range of 1,300–1,600 nm (OH first overtone) built for the prediction of potassium-chloride concentration: Regression vector.

