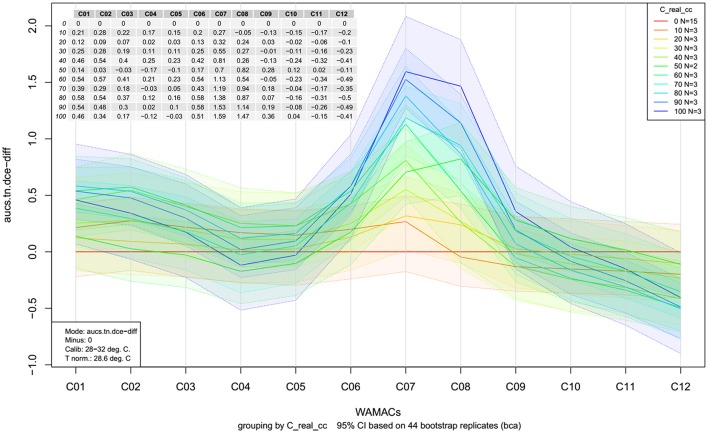
Figure 15.
Aquagrams with 95% confidence intervals of Milli-Q water and aqueous solutions of potassium-chloride in the concentration range of 10–100 mM calculated on the MSC transformed absorbance (logT-1) spectra in the spectral range of 1,300–1,600 nm (OH first overtone) using the linearized version of the “temperature-based” mode with average values.

