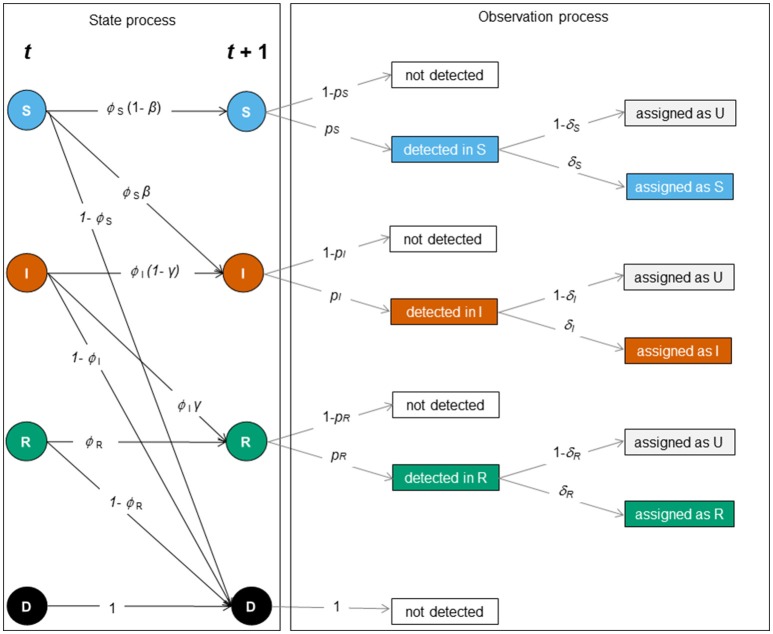
Figure 2.
Schematic representation of the SIR dynamics with state uncertainty between two sampling occasions, t and t + 1. The state or biological process (left) and the observation process (right) underlie the construction of the MECMR model. In the state process [corresponding to the matrix SIR_Model, Equation (1)], solid circles indicate infection states (S [blue]: “susceptible”, I [orange]: “infected,” R [green]: “recovered”) and the dead state (D, [black]). The solid black arrows indicate transition probabilities between those states as a function of the probability of surviving in a given state (ϕi, with i specific for S, I and R), i.e. the probability of staying susceptible (1 – β), becoming infected (β), staying infected (1- γ) or recovering (γ). The observation process was composed of two steps: detection of individuals [corresponding to the matrix Obs1, Equation (2)], and assignment of infection states [corresponding to the matrix Obs2, Equation (3)]. Events are shown in black solid boxes. Solid gray arrows indicate the detection probability of individuals in a given state (pj with j being specific for S, I, and R) and the assignment probability of individuals in a given state (δk with k being specific for S, I and R).

