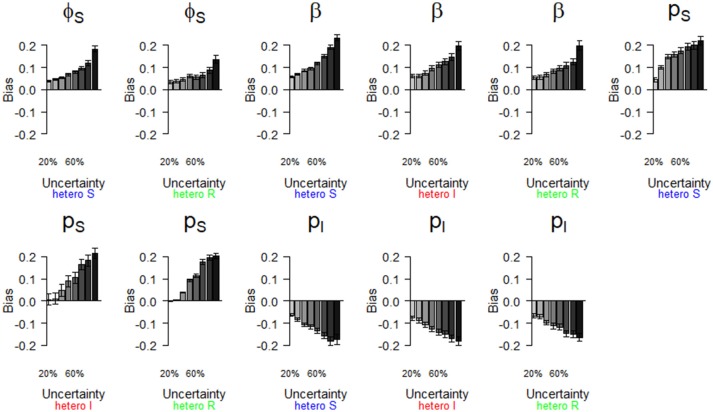
Figure 5.
Parameter estimates with a bias greater than |0.2| as a function of a heterogeneous increase in state uncertainty. Error bars represent 95% CI. The increasing state uncertainty corresponds to a decreasing probability of assigning an infection state. We used the following notations for the parameters: ϕS for the survival probability of individuals in the S state, β for the infection probability, pS and pI for the detection probability of individuals in S and I states, respectively. Scenarios of assignment heterogeneity were reducing by 50% the assignment probability of the S state compared to the assignment probability of the I and R states (“hetero S” (blue)), reducing by 50% the assignment probability of the I state compared to the S and R states (“hetero I” (red)) and reducing by 50% the assignment probability of the R state compared to S and I states (“hetero R” (green)).

