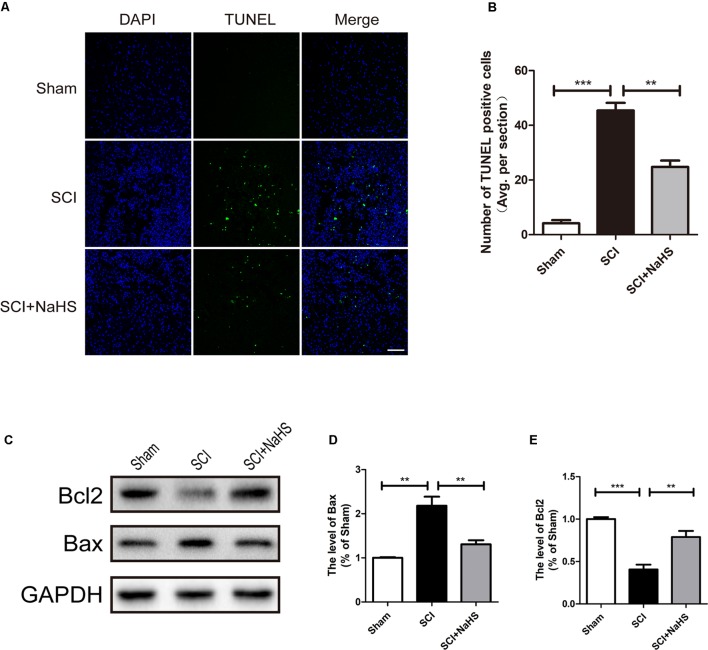
FIGURE 3.
NaHS treatment blocked SCI-triggered apoptosis at 1d after SCI. (A,B) TUNEL staining in the sham, SCI model and SC+NaHS-treated groups, Scale bar = 50 μm. (C–E) Representative western blots of Bax and Bcl2 in the sham, SCI model and SC+NaHS-treated groups. All data were presented as the mean ± SEM, n = 3. ∗∗P < 0.01 and ∗∗∗P < 0.001 versus the indicated group.

