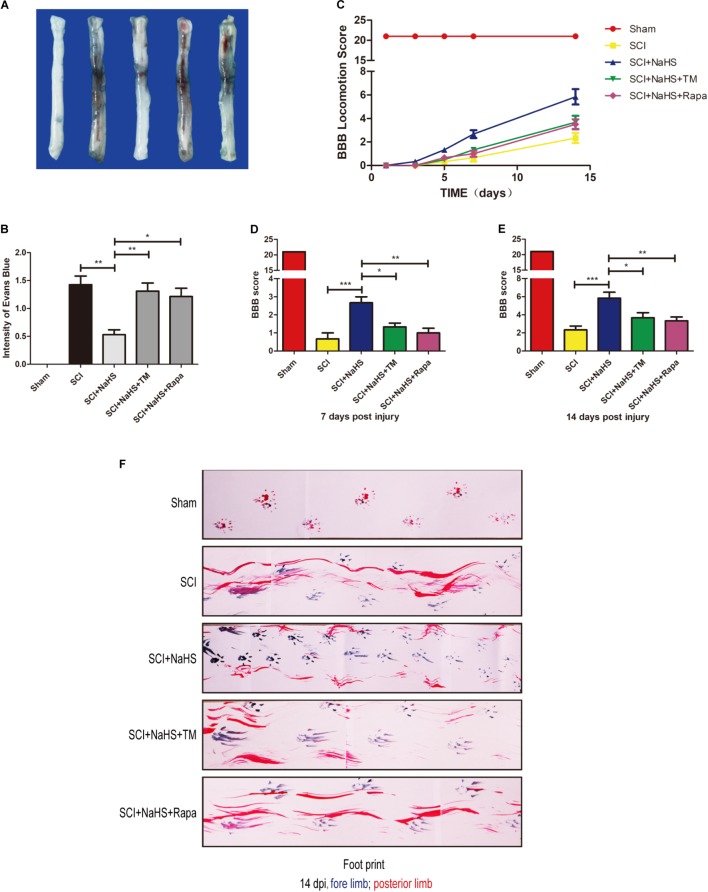
FIGURE 7.
NaHS prevents the disruption of BSCB and improves the functional recovery by inhibiting ER stress and autophagy after SCI. (A,B) Representative whole spinal cord tissues and quantification of BSCB permeability for each group, indicating that EB dye permeabilized into the spinal cord. All data are presented as the mean ± SEM, n = 5. ∗P < 0.05 and ∗∗P < 0.01 versus the SCI + NaHS group. (C) The BBB locomotion scores of the different groups 1, 3, 5, 7, and 14d after SCI, n = 10. (D,E) Quantification of the BBB locomotion scores at 7 and 14d from (C). All data are presented as the mean ± SEM, n = 10. ∗P < 0.05, ∗∗P < 0.01 and ∗∗∗P < 0.001 versus the SCI + NaHS group. (F) Footprint analysis results from the different groups.

