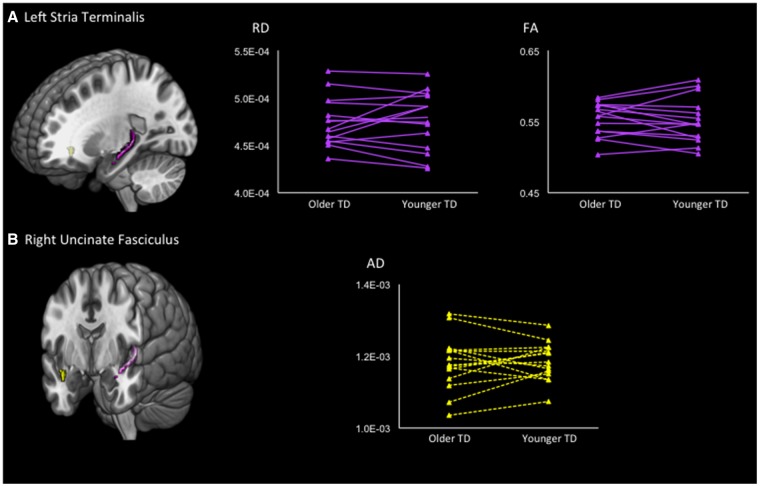
Fig. 1.
Results of intraclass correlation analyses between siblings with TD. The ROIs are shown in the left column. (A) Upper panel shows the left stria terminalis. In the right column, the line graphs show the RD and FA values of pairs of siblings with TD. The left dots of each line show the DTI values of the older siblings. Intraclass correlation analyses showed a statistically significant similarity in the mean RD (ICC = 0.772, P < 0.001) and FA (ICC = 0.704, P = 0.001). (B) Axial diffusivity in the right uncinate fasciculus exhibited a statistically significant intraclass correlation (ICC = 0.682, P = 0.002).

