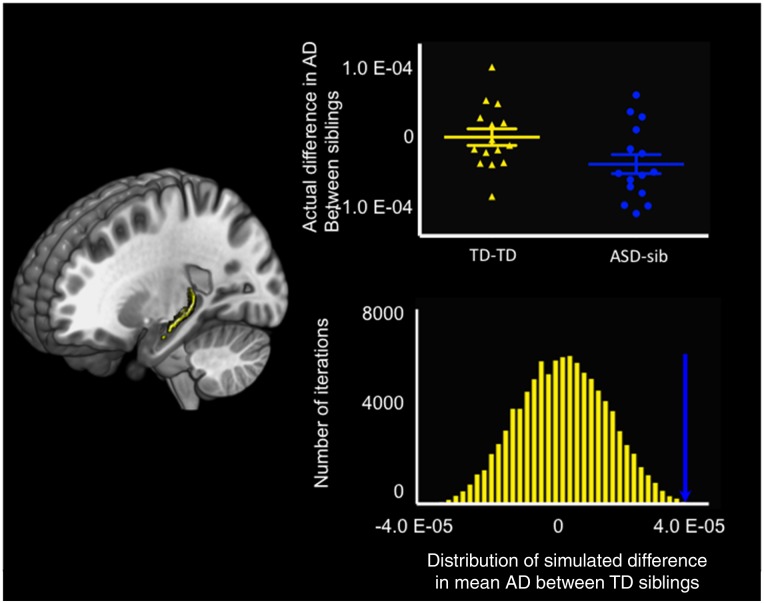
Fig. 3.
Results of bootstrapping. The left column shows the extension of the left stria terminalis. The upper subpanel in the left column demonstrates the actual difference in the mean AD values between TD siblings (shown in yellow) and the difference between individuals with ASD and their unaffected brothers (shown in blue). In the lower subpanel in the left column, the distribution of the differences in mean AD values between TD siblings as computed using bootstrapping with 100 000 iterations is shown in yellow. The blue arrow demonstrates the actual difference in mean AD values in the left stria terminalis between individuals with ASD and their unaffected brothers.

