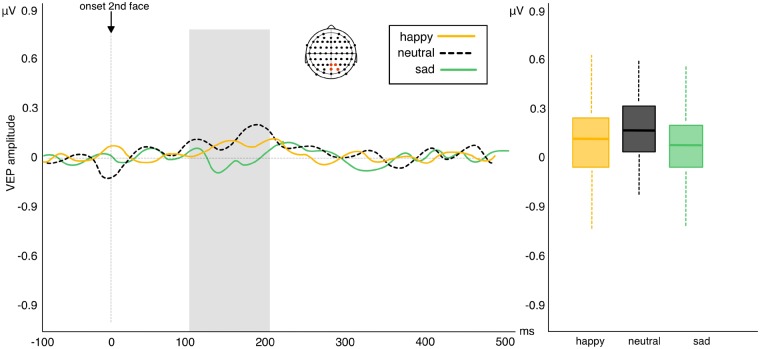
Fig. 5.
Left: amplitude of VEP difference scores (repetition—alternation trials) in response to viewing sad, happy and neutral facial expressions in experiment 2. Positive waveforms highlight a higher amplitude in repeated relative to alternated trials. Negative waveforms highlight reduced amplitude in repeated relative to alternated trials. Right: box plots showing no difference in VEP repetition effects between the three levels of valence (whiskers represent s.d.).

