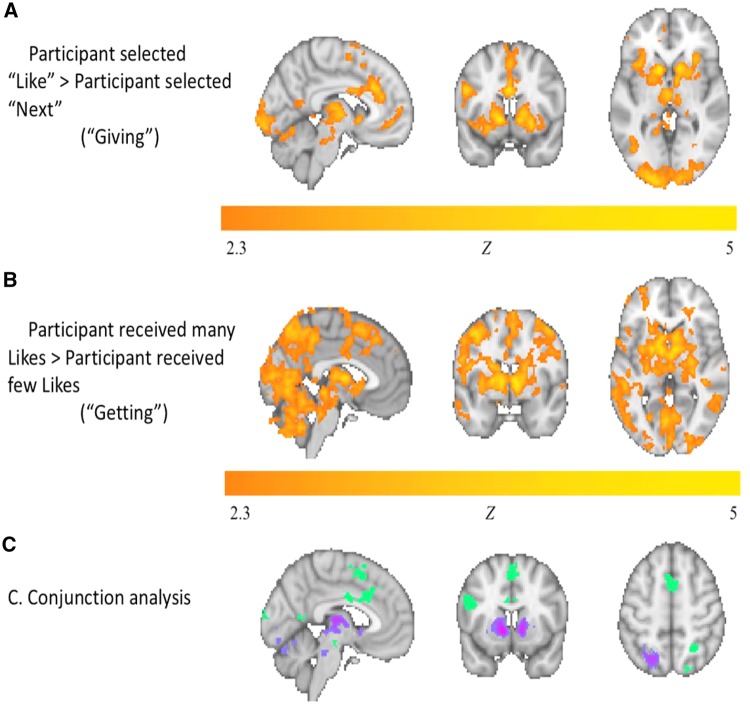
Fig. 1.
Panels (A and B) depict, respectively, activation when participants provided a Like to others (compared with choosing ‘Next’) and when participants received many Likes from others (compared with few Likes); Z > 2.3, P < 0.001. Panel (C) depicts areas of overlap between these contrasts. Brain regions in purple survived cluster correction at P < 0.001 (Z > 2.3) in a conjunction analysis of these contrasts; brain regions in light green depict overlap in significant findings but do not survive cluster correction.

