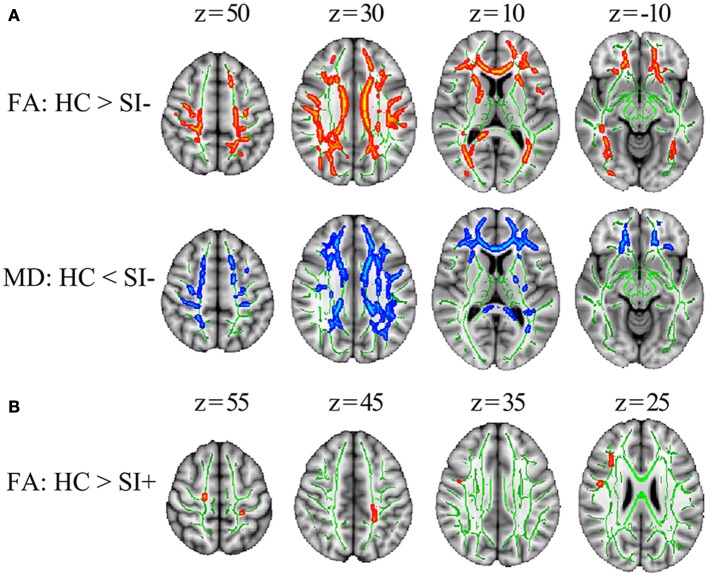
Figure 1.
The TBSS results comparing FES patients and healthy controls (HC). (A) The differences in FA and MD between the patients without suicidal ideation (SI–) and HC. (B) The differences in FA between the patients with suicidal ideation (SI+) and HC. Significant areas (p < 0.05, corrected) were marked in orange (higher in HC) or blue (lower in HC) with underlying WM skeleton marked in green. FA, fractional anisotropy; MD, mean diffusivity; x, y, z, MNI coordinates.

