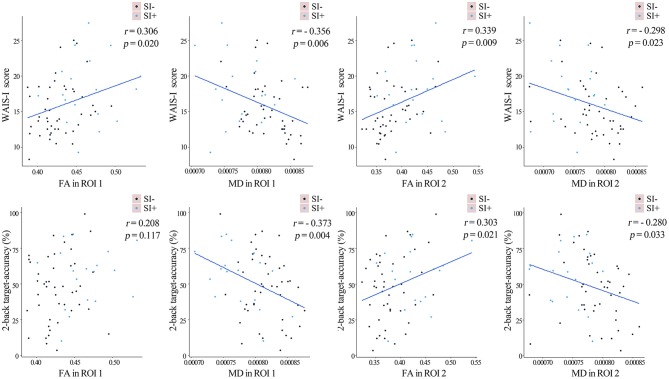
Figure 4.
The linear fits representing the partial correlations between the FA/MD values in the two regions of interest (ROI) as described in Figure 2B and cognitive performances in the whole sample of FES patients, after controlling for age, gender, years of education and SAPS/SANS scores. The FES patients with (SI+) and without (SI–) suicidal ideation were marked in blue and purple separately. FA, fractional anisotropy; MD, mean diffusivity.

