Figure 3.
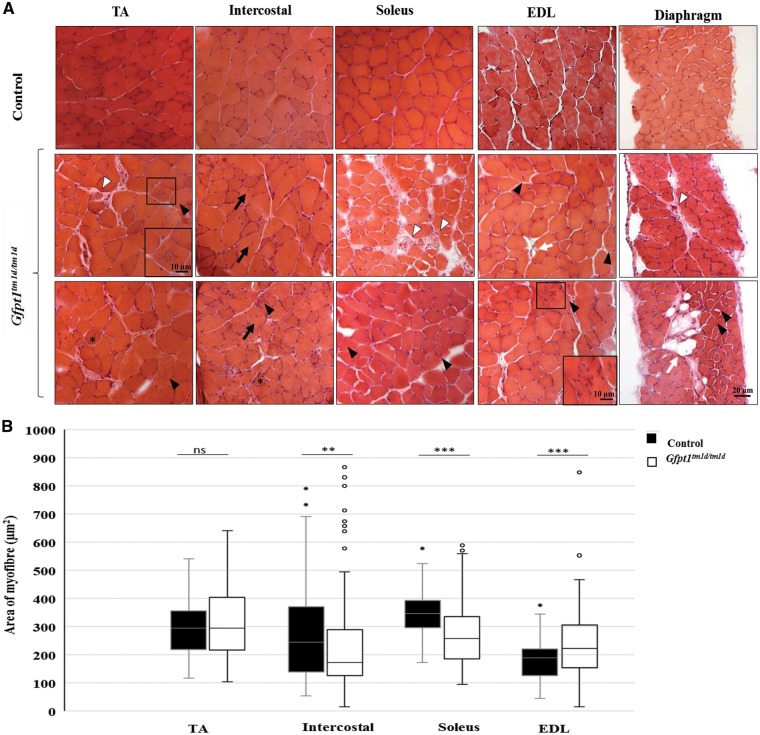
Characteristics and myopathic changes in muscle from Gfpt1tm1d/tm1d mice. (A) Representative TA, intercostal, soleus, EDL and diaphragm muscles stained with haematoxylin and eosin from control and Gfpt1tm1d/tm1d mice. Rounded myofibres (asterix), centrally located nuclei in myofibres (black arrows), tubular aggregates (black arrow head), necrotic fibres (white arrow head), adipose tissue (white arrows). Hypertrophic and atrophic myofibres are also present. (B) Quantitative analyses demonstrating the distribution of myofibre size according to CSA. Data are median, 25th percentile, 75th percentile, minimum and maximum values (including outliers). **P < 0.01; ***P < 0.001; ns, not significant (Mann–Whitney U test) (n = 4).

