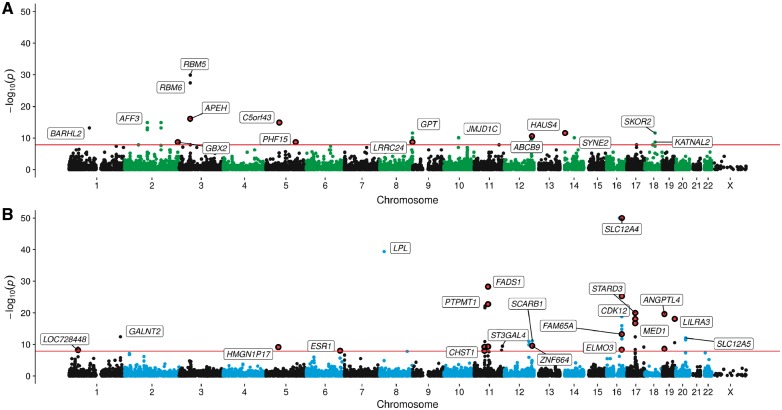
Figure 2.
Manhattan plots illustrating results of two-sample MR analysis between epigenome-wide DNA methylation and (A) educational attainment (top) and (B) HDL cholesterol (bottom). Points represent –log 10 P-values (y-axis) for CpG sites (genomic location on the x-axis) as evaluated using two-sample MR analysis between DNA methylation (as our exposure) and complex traits (as our outcome) using meQTL as genetic instruments. Effects that survive the multiple testing threshold in our analysis (P < 1.397 × 10−08—represented by the red horizontal line) are annotated using mapped genes according to Illumina (or nearest gene when no gene has been reported by Illumina). Effects where JLIM suggested the causal variant for DNA methylation and complex trait variation were the same are highlighted in red.

