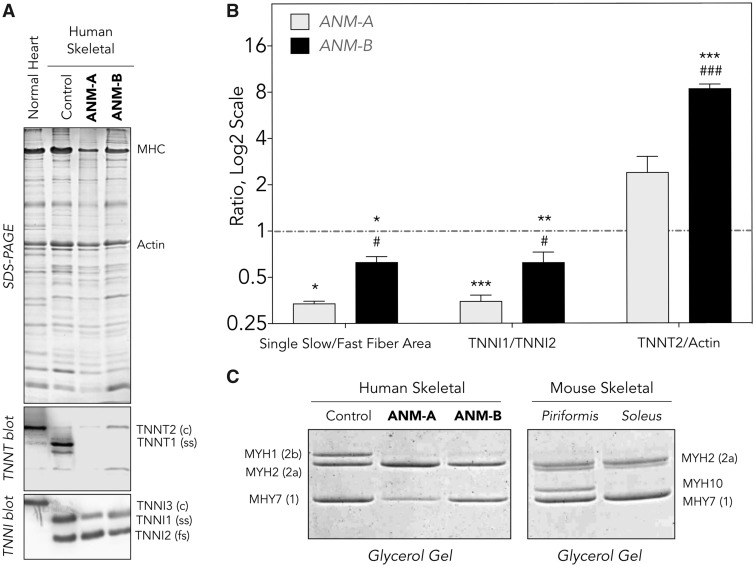
Figure 4.
Protein Expression in ANM muscle. (A) SDS-gel and western blot of total protein extracts from frozen muscle sections reveals complete loss of TNNT1 (slow skeletal TnT) in TNNT1 c.505G>T homozygous children ages 14 (ANM-A) and 16 (ANM-B) months. The expression of slow TNNI1 (TnI) is decreased, indicating an overall reduction of slow fiber content. Significant expression of cardiac TNNT2 (cardiac TnT) was detectable, reflecting adaptive muscle regeneration. (B) Densitometry analysis of the western blots normalized to protein inputs quantified in parallel SDS-gel confirmed that, relative to normal muscle control tissue (red dashed line), ANM muscles (gray shaded and solid bars) has a 2- to 3-fold lower ratio of slow to fast fibers and slow TNNI1 to fast TNNI2, as well as more abundant cardiac TNNT2, as sign of adaptive muscle regeneration. (C) Relative to human control muscle, TNNT1 c.505G>T homozygotes had decreased MYH7 (Type 1 myosin) whereas MHY2 (skeletal muscle myosin type 2a) was modestly increased and MHY1 (skeletal muscle myosin type 2b) drastically decreased. These are compared with protein expression in normal murine skeletal muscle. Values are presented as mean±SE. N = 4–10 sections of ANM-A or ANM-B muscle. **P < 0.01 and ***P < 0.001 versus WT; #P < 0.05 and ###P < 0.001 versus ANM-A using Student’s t test. ANM, Amish nemaline myopathy; c, cardiac isoform; fs, fast skeletal isoform; ss, slow skeletal isoform.

