Figure 5.
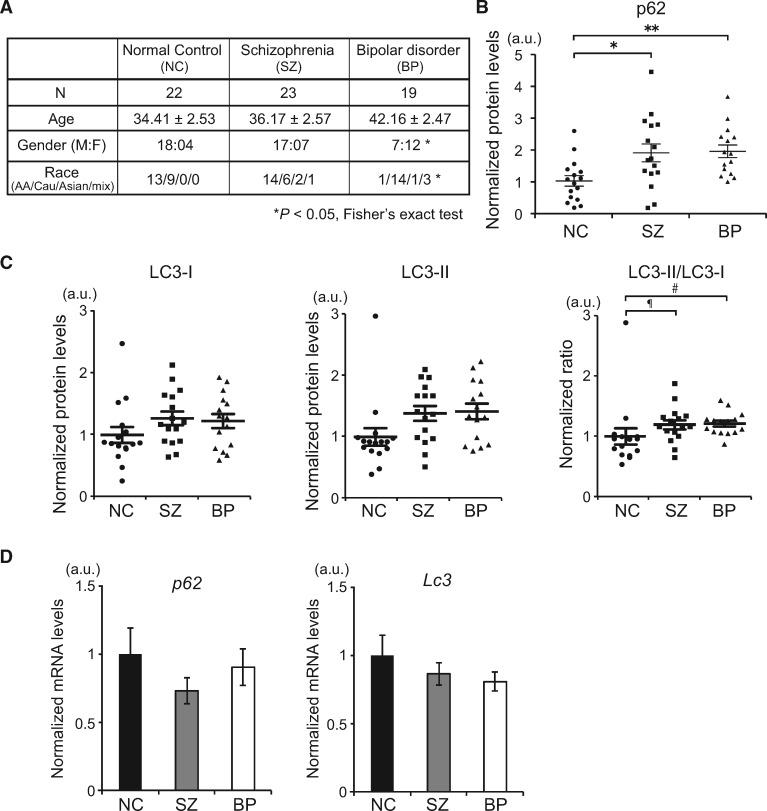
Attenuated autophagy in olfactory neuronal cells in sporadic cases of psychiatric disorders. (A) Demographics of human subjects in this study. *P <0.05 (Fisher’s exact test). (B) The relative protein expression levels of p62 for each subject of control (circle), SZ (square) and BP (triangle) evaluated by western blot. *P<0.05, **P<0.01 (one-way ANOVA). See also Supplementary Material, Fig. S4A and B. (C) The relative protein expression levels of LC3-I, LC3-II and their ratio (LC3-II/LC3-I) for each subject of control (circle), SZ (square) and BP (triangle) evaluated by western blot. ¶P=0.067175, #P=0.054516. (D) qPCR analysis of p62 and Lc3 mRNA expression in control or patients-derived olfactory neuronal cells. No statistical significance (one-way ANOVA).

