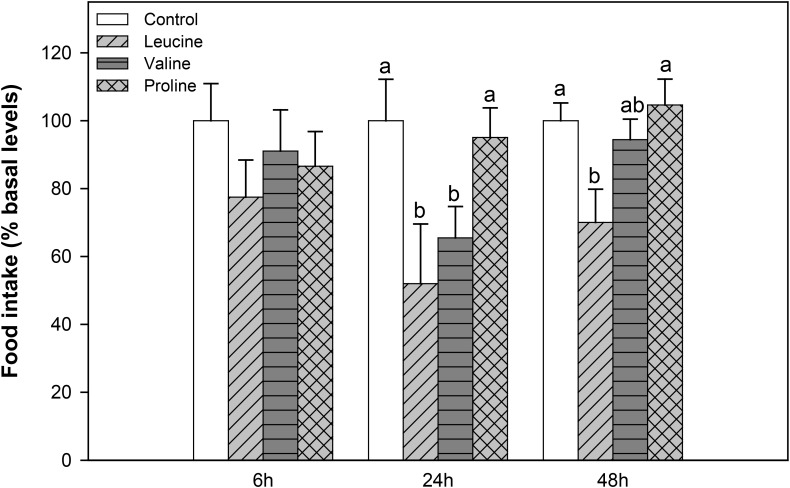
FIGURE 2.
Food intake in rainbow trout 6, 24, and 48 h after intraperitoneal administration of 0.5 mL⋅100 g-1 body mass of saline solution alone (control) or containing 40 μmol⋅mL-1 of L-leucine, 40 μmol⋅mL-1 of L-valine, or 40 μmol⋅mL-1 of L-proline. Food intake is displayed as mean + SEM of the percentage of food ingested with respect to baseline levels (calculated as the average of food intake in the 3 days previous to the experiment), from three different experiments in which 10 fish were used per group in each tank. Different letters indicate significant differences (P < 0.05) between different groups. P-values are: at 6 h, = 0.389; at 24 h, C vs L = 0.017, C vs V = 0.030, C vs P = 0.838, L vs V = 0.412, L vs P = 0.015, V vs P = 0.029; and at 48 h, C vs L = 0.037, C vs V = 0.817, C vs P = 0.869, L vs V = 0.237, L vs P = 0.039, V vs P = 0.639.

