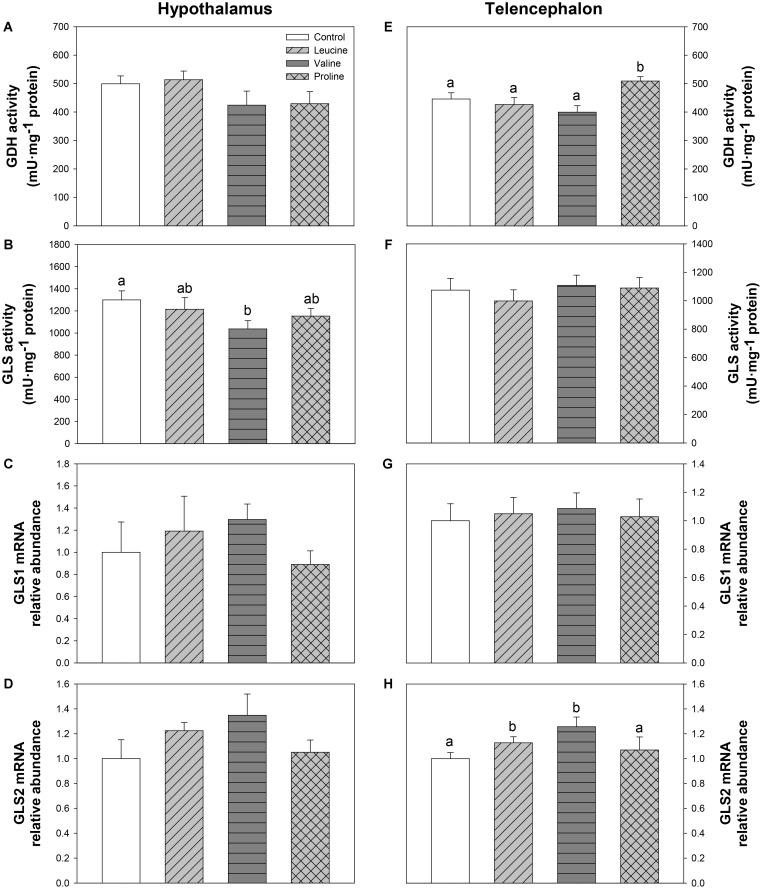
FIGURE 7.
Parameters related to glutamine metabolism. Activities of GDH (A,E) and GLS (B,F), and mRNA levels of GLS1 (C,G), and GLS2 (D,H) in hypothalamus (A–D) and telencephalon (E–H) of rainbow trout 6 h after intraperitoneal administration of 0.5 mL⋅100 g-1 body mass of saline solution alone (control) or containing 40 μmol⋅mL-1 of L-leucine, 40 μmol⋅mL-1 of L-valine, or 40 μmol⋅mL-1 of L-proline. Each value is the mean + SEM of n = 10 (enzymatic activity) or n = 6 (mRNA levels) fish per treatment. Gene expression results are referred to control group and are normalized by EF1α and β-actin expression. Different letters indicate significant differences (P < 0.05) between different groups. P-values are: for (A), = 0.258; for (B), C vs L = 0.543, C vs V = 0.026, C vs P = 0.142, L vs V = 0.096, L vs P = 0.631, V vs P = 0.209; for (C), = 0.640; for (D), = 0.242; for (E), C vs L = 0.547, C vs V = 0.298, C vs P = 0.038, L vs V = 0.372, L vs P = 0.032, V vs P = 0.004; for (F), = 0.764; for (G), = 0.962; and for (H), C vs L = 0.037, C vs V = 0.016, C vs P = 0.385, L vs V = 0.088, L vs P = 0.040, V vs P = 0.102.

