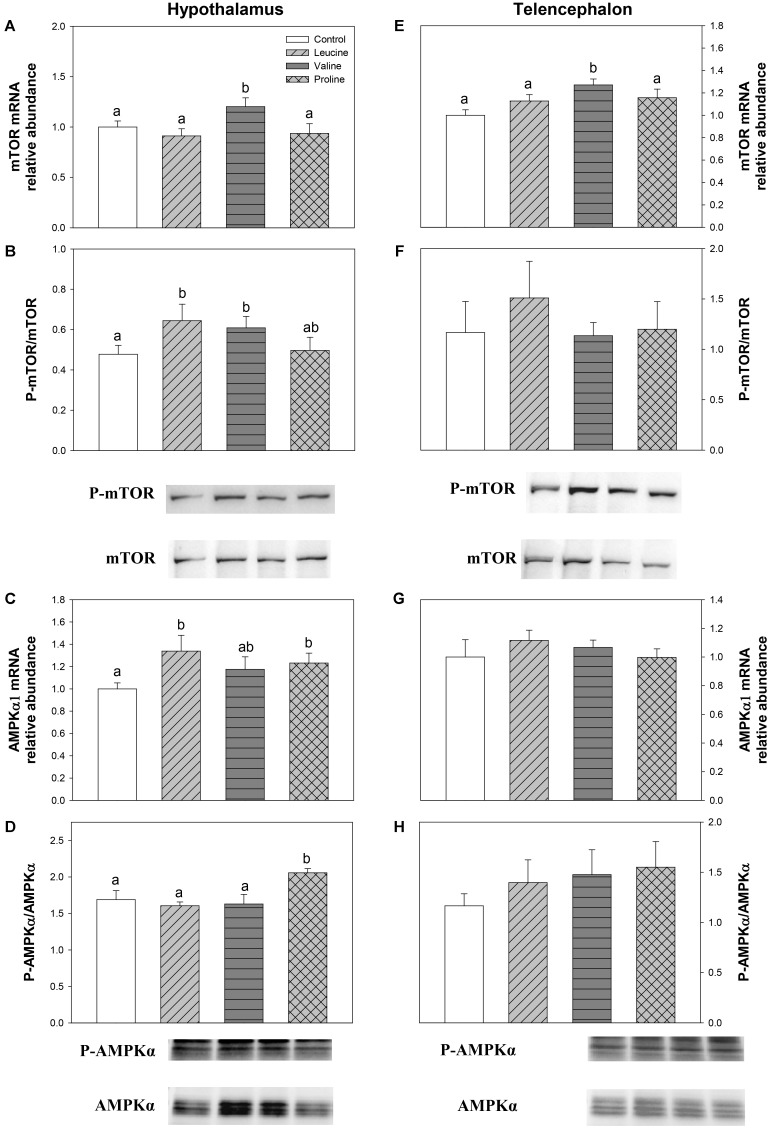
FIGURE 8.
Parameters related to mTOR/AMPKα. mRNA levels (A,E) and western blot analysis of phosphorylation status (B,F) of mTOR, and mRNA levels (C,G) and western blot analysis of phosphorylation status (D,H) of AMPKα in hypothalamus (A–D) and telencephalon (E–H) of rainbow trout 6 h after intraperitoneal administration of 0.5 mL⋅100 g-1 body mass of saline solution alone (control) or containing 40 μmol⋅mL-1 of L-leucine, 40 μmol⋅mL-1 of L-valine, or 40 μmol⋅mL-1 of L-proline. Each value is the mean + SEM of n = 6 fish per treatment. Gene expression results are referred to control group and are normalized by EF1α and β-actin expression. In western blot analysis, 20 μg of total protein were loaded on the gel per lane. Western blots were performed on six individual samples per treatment, and a representative blot per treatment is shown here. Western blot graphs (B,F,D,H) represent the ratio between the phosphorylated protein and the total amount of the target protein. Different letters indicate significant differences (P < 0.05) between different groups. P-values are: for (A), C vs L = 0.375, C vs V = 0.033, C vs P = 0.573, L vs V = 0.023, L vs P = 0.854, V vs P = 0.036; for (B), C vs L = 0.037, C vs V = 0.015, C vs P = 0.821, L vs V = 0.729, L vs P = 0.091, V vs P = 0.126; for (C), C vs L = 0.032, C vs V = 0.165, C vs P = 0.036, L vs V = 0.389, L vs P = 0.561, V vs P = 0.711; for (D), C vs L = 0.818, C vs V = 0.822, C vs P = 0.033, L vs V = 0.537, L vs P < 0.001, V vs P = 0.032; for (E), C vs L = 0.164, C vs V = 0.029, C vs P = 0.102, L vs V = 0.039, L vs P = 0.731, V vs P = 0.045; for (F), = 0.786; for (G) = 0.681; and for (H) = 0.638.

