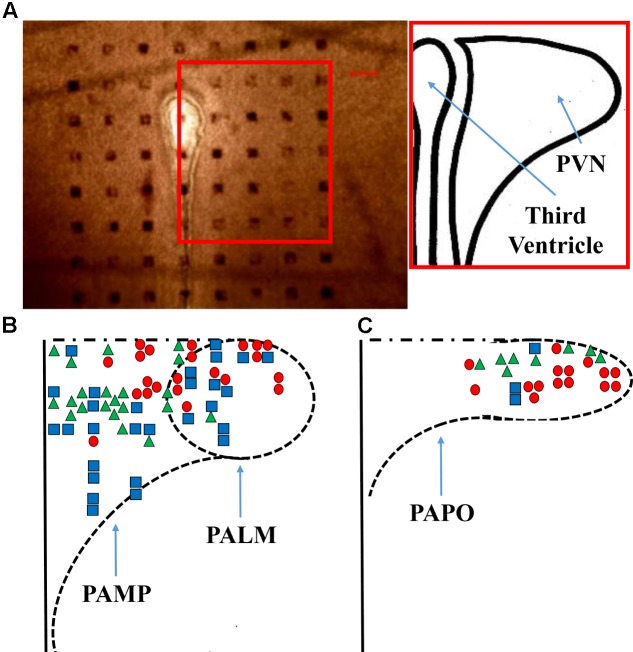
FIGURE 1.
Probe positioning. (A) A representative micrograph of the PVN slice positioning over the probe is shown, the bar indicates 100 μm and the inset shows a representation of the nucleus. A diagram (B,C) shows all the responses obtained from the application of ghrelin. PAMP = medial parvocellular; PALM = lateral magnocellular; and PAPO = posterior parvocellular portions of the paraventricular nucleus. Triangles, squares, and circles represent, respectively, increased, unchanged, and decreased firing frequency.

