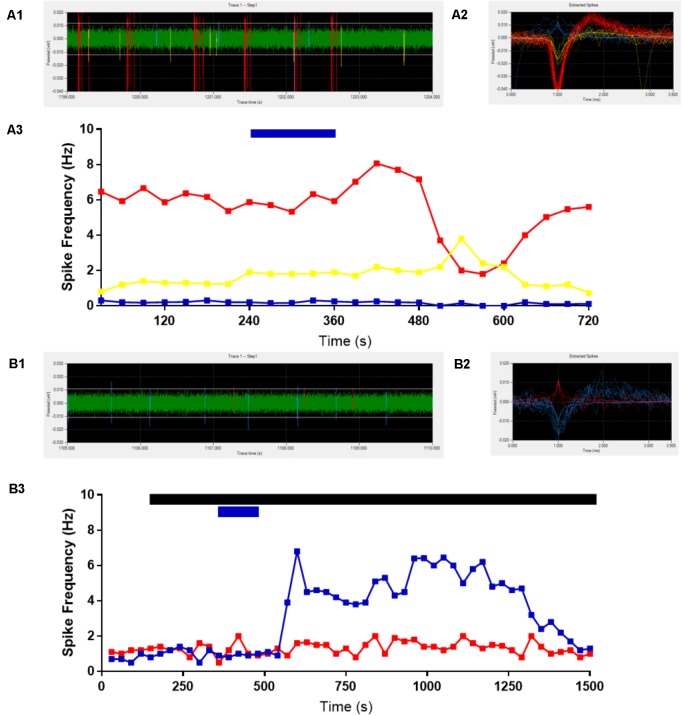
FIGURE 2.
Representative extracellular recordings. Channels with detectable spikes and correct positioning were selected for analysis. One channel is shown as representative (A), 3 neurons were identified (A1,A2) and ghrelin application decreased (red line), increased (yellow line) or did not change (blue line) firing frequency (1/3 each) (A3). The addition of GABAA and Glutamate receptor antagonists to the bath (black bar) abolishes the decreases in activity due to 10 nM ghrelin application (blue bar). Another representative recording is shown (B), in which two neurons were identified in the trace (B1,B2). Ghrelin increased firing frequency in one (blue line) and did not affect the other (red line) (B3).

