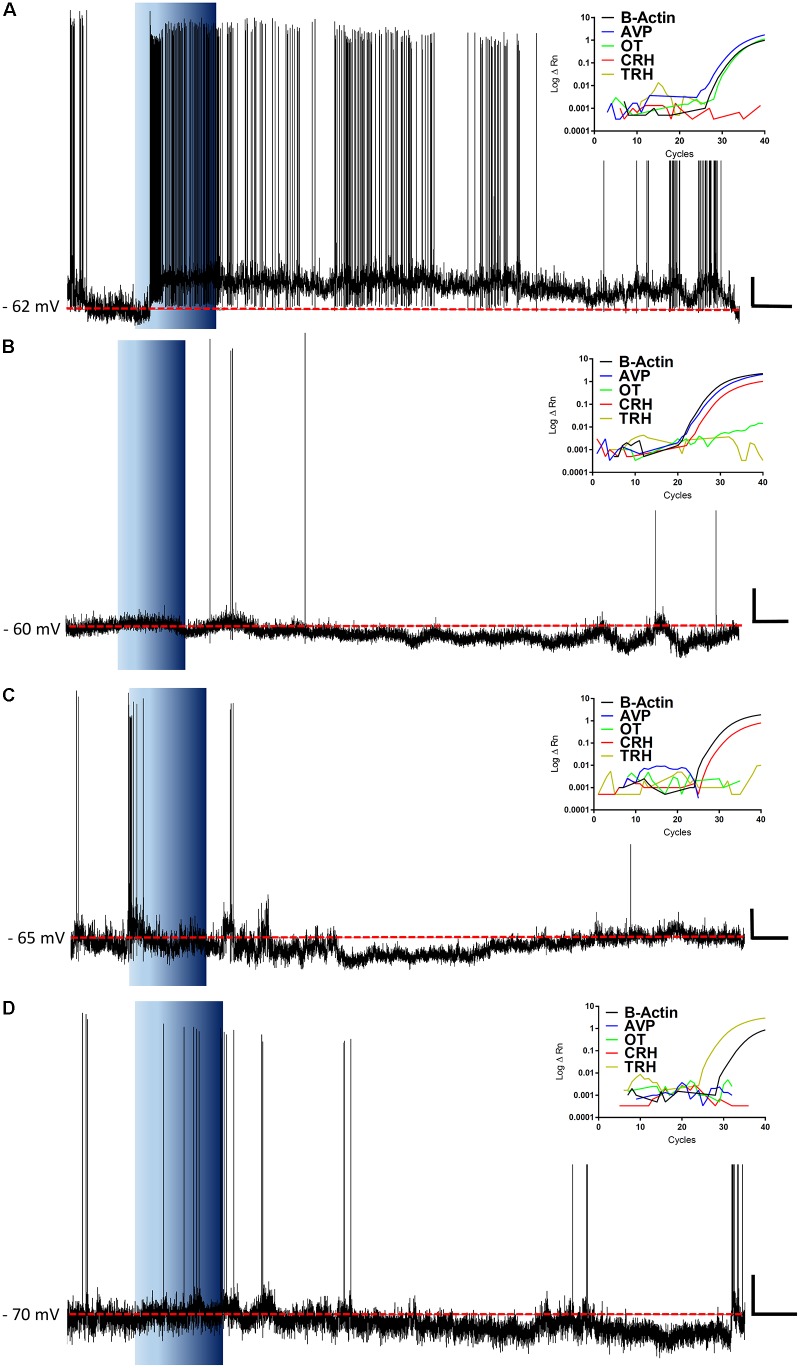
FIGURE 9.
Representative recordings and RT-PCRs. The figure shows representative traces for ghrelin responsive neurons and the insets show their respective amplification plots for β-Actin, AVP, OT, CRH, and TRH mRNA. Note, a neuron that depolarizes in response to ghrelin and expresses both AVP and OT mRNA, with the predominance of AVP (A); hyperpolarizations in CRH expressing neurons, either with AVP-CRH coexpression (B) or with CRH only (C); and a hyperpolarization in a TRH neuron (D). Blue background indicates 10 nM ghrelin application; red dashed line represents mean membrane potential; vertical scale bar represents 10 mV; and horizontal scale bar represents 60 s.

