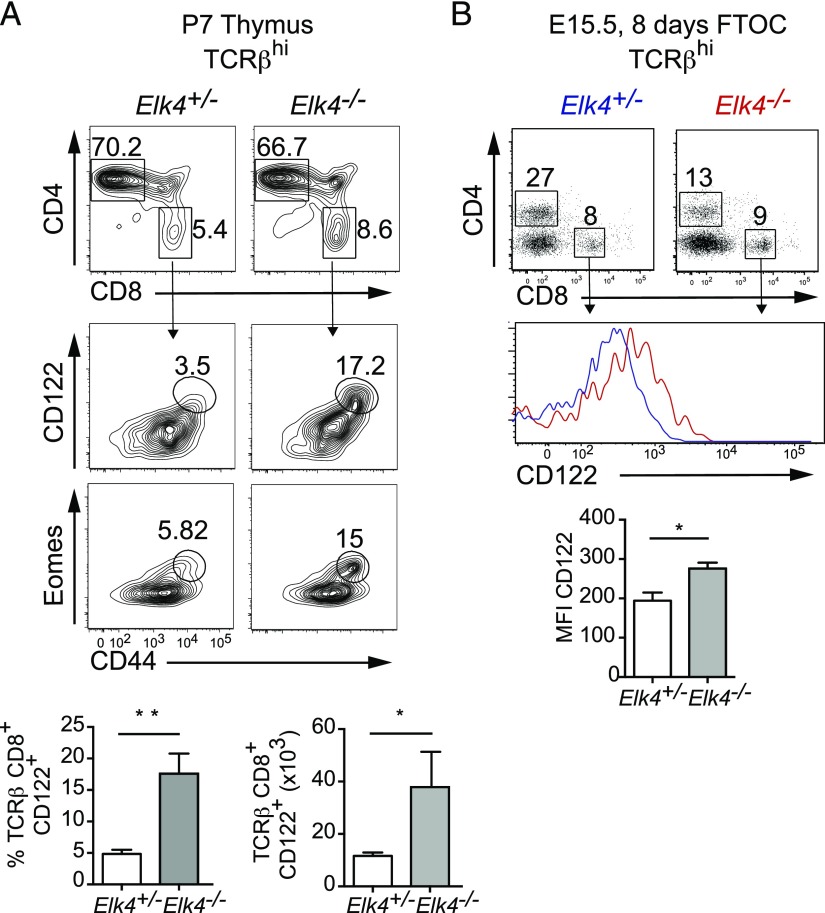
FIGURE 3.
Innate CD8+ T cells develop in the thymus. (A) Percentages of CD4 and CD8 cells in TCRβhi thymocytes isolated from P7 Elk4+/− and Elk4−/− littermates (top panels) and expression of CD44, CD122, and Eomes in TCRβhi CD8+-gated thymocytes (middle panels). Bottom, Proportions and absolute numbers of TCRβhi CD122+ CD8+ innate-like T cells. n ≥ 5 animals per genotype. (B) Profile of thymocytes stained with anti-CD4 and anti-CD8 from FTOC at day 8 (upper panel). Representative histogram of CD122 expression on TCRβhi CD8+-gated thymocytes from Elk4+/− (blue) and Elk4−/− (red) from day 8 FTOC (center panel). n ≥ 4 thymic lobes per genotype. Data are expressed as mean ± SEM. Statistical significance: *p < 0.05, **p < 0.01 (unpaired t test).

