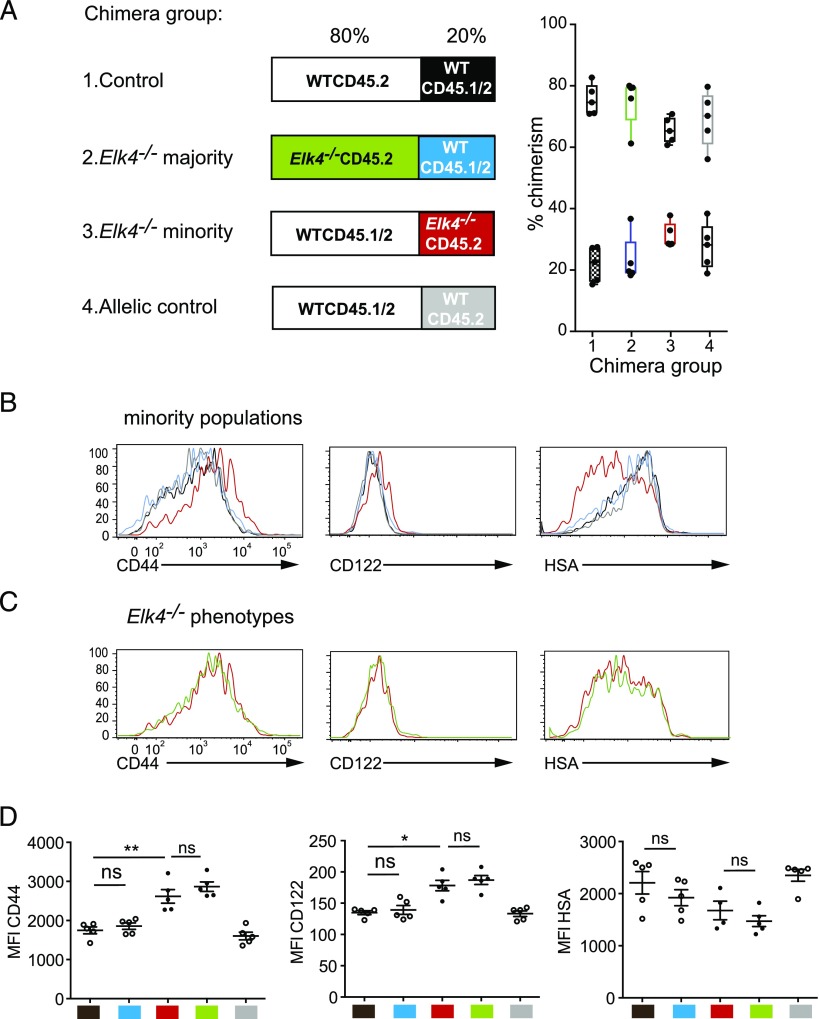
FIGURE 4.
Elk4−/− αβ CD8+ innate-like T cell development in thymus is cell intrinsic. (A) Experimental strategy. Four groups of mixed bone marrow were transferred into irradiated CD45.1 hosts. Left panel, Each box indicates the majority and minority genotypes, with details given above, and experimental populations highlighted in color. Group 1: minority WT CD45.1/2 (20%, black), majority WT CD45.2 (80%). Group 2: minority WT CD45.1/2 (20%, blue), majority Elk4−/− CD45.2 (80%, green). Group 3: minority Elk4−/− CD45.2 (20%, red), majority WTCD45.1/2 (80%). Group 4: minority WTCD45.2 (20%, gray), majority WT CD45.1/2 (80%). Right panel, Level of chimerism in individual mice analyzed is represented for each group by a box-and-whiskers plot with minimum to maximum value. Each mouse is represented by two data points. (B) No bystander effects on minority population. Expression of CD44, CD122, and HSA on the minority TCRβhi CD8+ populations in each group is shown. Black versus blue: no influence of majority Elk4 genotype on WT cells. Red versus gray: Elk4−/− phenotype is detectable among majority WT cells. Black versus gray: no influence of CD45 allelic background. (C) Expression of CD44, CD122, and HSA on Elk4−/− cells among WT cells as the minority population (Group 3, red) or the majority population (Group 2, green). (D) Summary of results. Mean fluorescence intensity for CD44, CD122, and HSA for each population are color coded as in (A); comparisons made as in (B) and (C). Error bars represent SEM; n = 5 animals per group. Similar results were obtained when reconstitution was performed in Rag2−/− hosts (Supplemental Fig. 4). Statistical significance: ns, nonsignificant, *p < 0.05, **p < 0.01 (paired t test).

