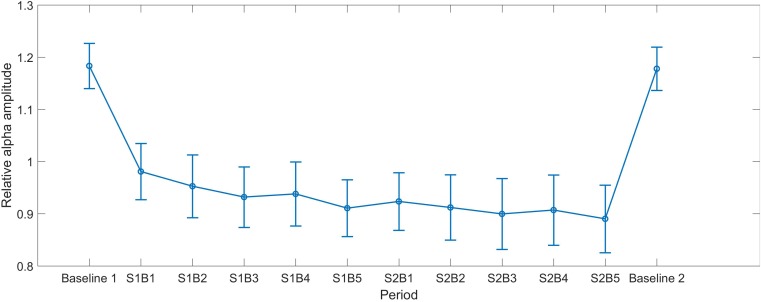
FIGURE 1.
The mean alpha curves across all periods. S indicates session and B indicates block, e.g., S1B1 indicates the first block in Session 1. Baseline 1 and Baseline 2 represent the eyes-open baseline before and after NF, respectively. The error bars represent the standard error of the mean (SEM).

