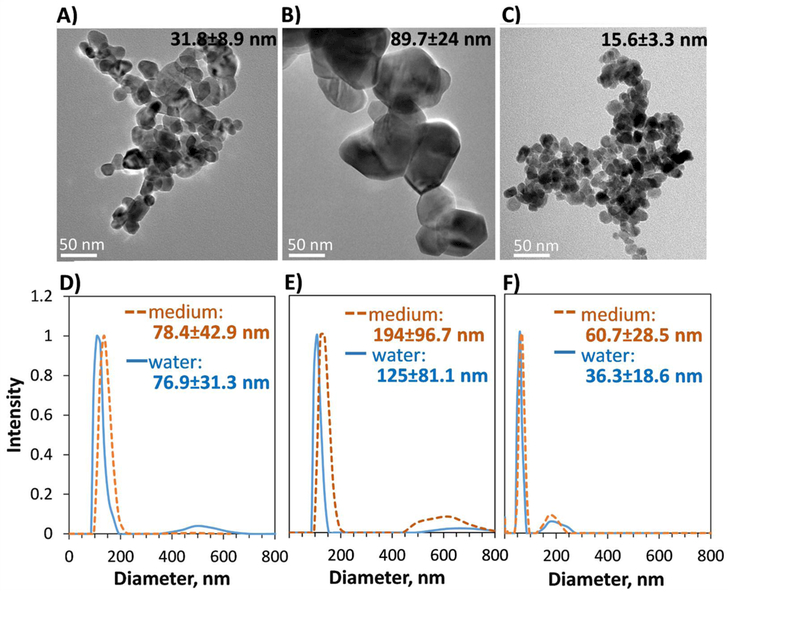
Figure 1. TEM images and hydrodynamic size of ZnO and CuO nanoparticles.

A-C) TEM images; primary particle size with standard deviation (based on 20–30 particles) is shown. (A) ZnO-30, (B) ZnO-80, (C) CuO. (D-E) hydrodynamic size (Dh) distribution of particles in water and in cell culture medium that was used in the cellular assays; average and standard deviation of Dh is shown on each graph. (D) ZnO-30, (E) ZnO-80, (F) CuO.
