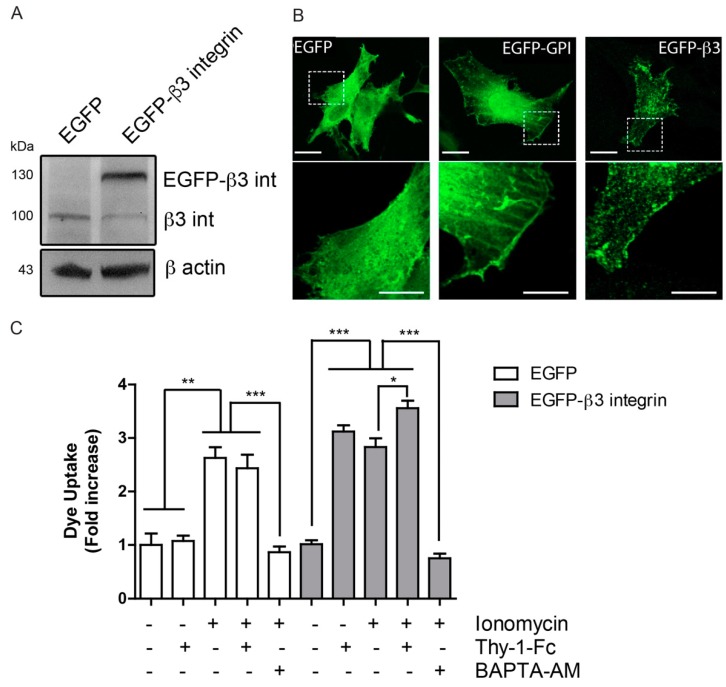
Figure 3.
β3 integrin overexpression forms integrin clusters at the cell surface. (A) Cell lysates of primary astrocytes transfected with pEGFP or pEGFP-β3 integrin were immunoblotted for β3 integrin and β-actin as a loading control; (B) Confocal images of primary astrocytes transfected with pEGFP, pEGFP-GPI or pEGFP-β3 integrin were acquired 24 h after plasmid transfection. Scale bar = 20 µm. Outlined area defines the optically zoomed region shown below each photograph (bar = 10 µm); (C) Dye uptake by primary astrocytes transfected as in A, stimulated with Thy-1-Fc or ionomicyn (1 µM) for 10 min, or treated with the intracellular calcium chelator BAPTA-AM (5 µM) for 30 min prior to stimuli. Values in the graph are the mean fluorescence intensity normalized to the non-stimulated condition. Results show mean ± s.e.m. from three independent experiments, * p < 0.05, ** p < 0.01, *** p < 0.001.

