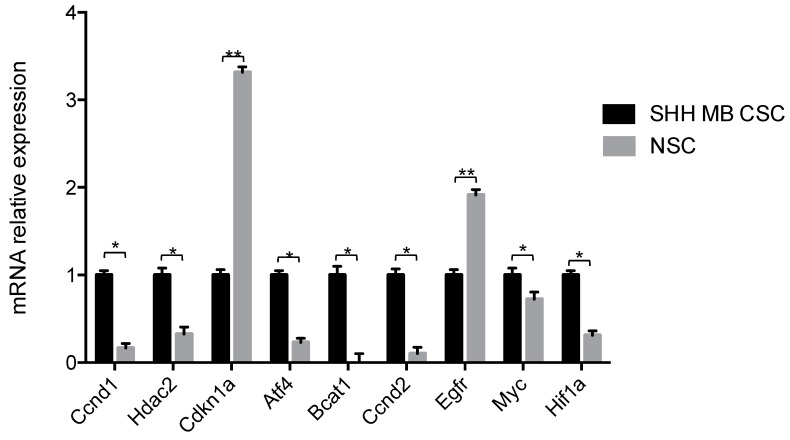
Figure 3.
Validation of transcriptome in SHH MB CSC versus NSC. mRNA expression levels of Ccnd1, Hdac2, Cdkn1a, Atf4, Bcat1, Ccnd2, Egfr, Myc, and Hif1a in SHH MB CSCs compared to NSCs. Results are shown in relative expression and data are means ± SD from three independent experiments. p-values *p < 0.05; ** p < 0.01.

