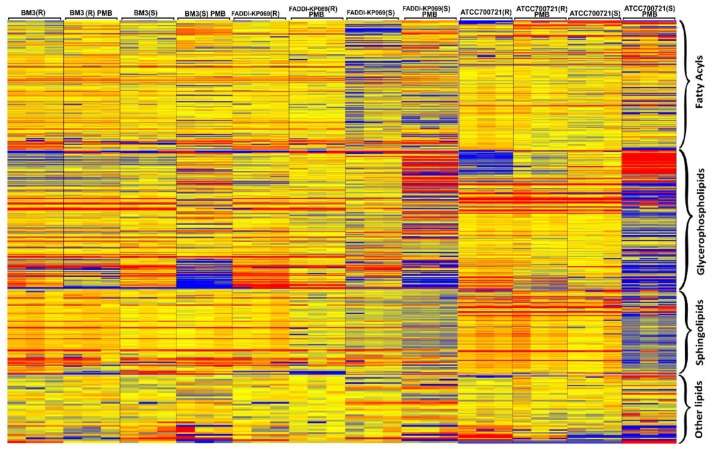
Figure 2.
The heat map illustrates the relative peak intensity of lipids within each class in the OMVs of the paired polymyxin-susceptible and -resistant K. pneumoniae isolates. (R) = polymyxin-resistant; (S) = Polymyxin-susceptible. Colours indicate relative abundance of lipidomes based on the relative peak intensity (red = high, yellow = no change, blue = undetectable).

