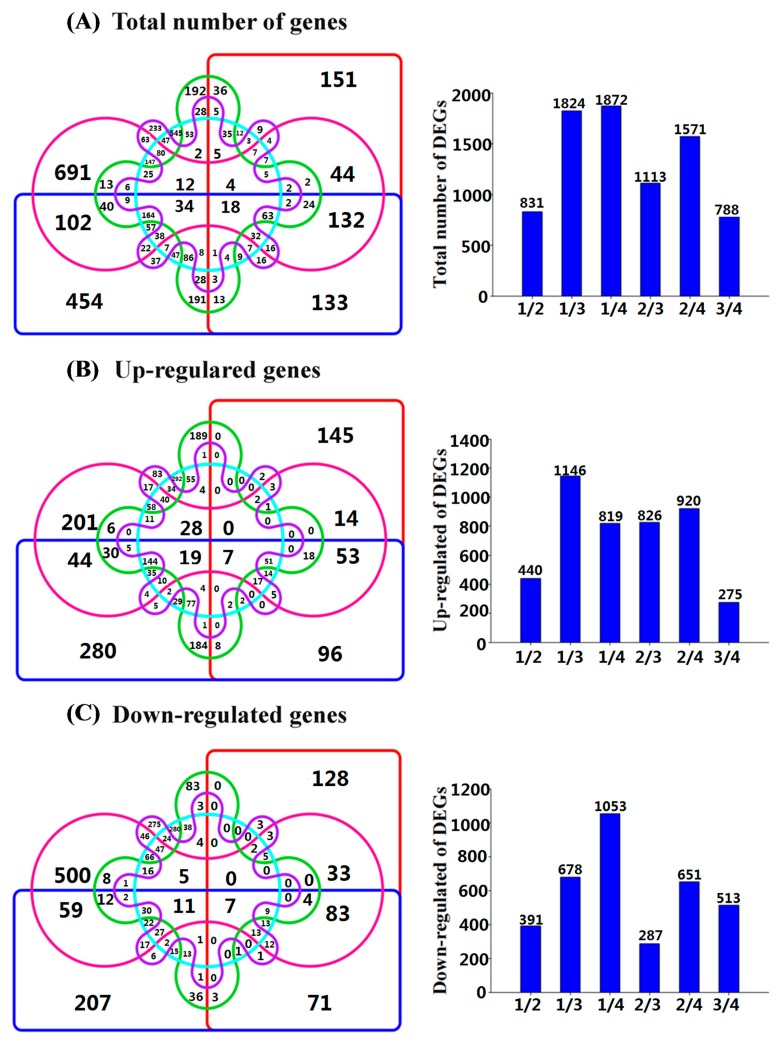
Figure 3.
Venn diagrams of differentially expressed genes (DEGs) in stem cuttings of ‘T337’ apple root stocks during the different stages of AR formation. (1/2: S1 vs. S2, 1/3: S1 vs. S3, 1/4: S1 vs. S4, 2/3: S2 vs. S3, 2/4: S2 vs. S4, and 3/4: S3 vs. S4 are the number of DEGs between S1 and S2, S1 and S2, S1 and S4, S2 and S3, S2 and S4, as well as S3 and S4). (A): Total number of DEGs; (B) up-regulated DEGs; (C) down-regulated DEGs. The bars indicate the number of total DEGs, up-regulated DEGs and down-regulated DEGs in S1 vs. S2, S1 vs. S3, S1 vs. S4, S2 vs. S3, S2 vs. S4, and S3 vs. S4, respectively.

