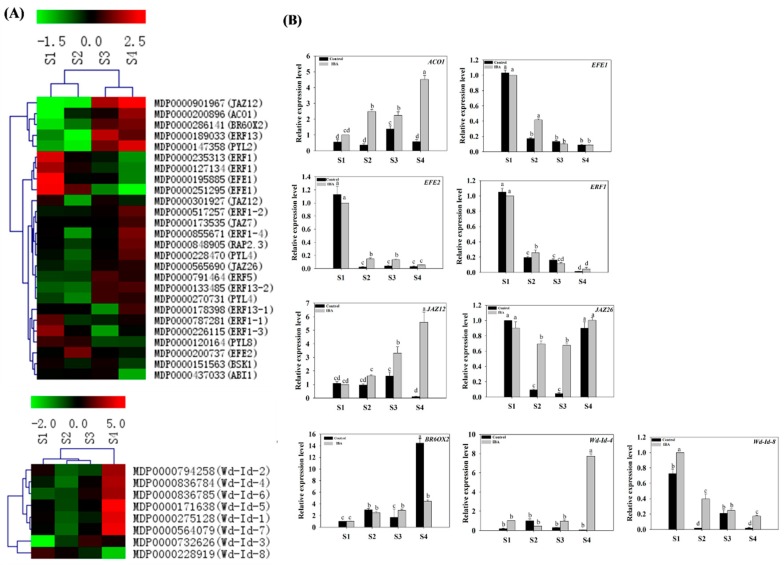
Figure 7.
Expression profiles of ethylene-, brassinolide-, jasmonic acid-, abscisic acid-, and wound induction-related genes in stem cuttings of ‘T337’ apple rootstocks during AR formation. (A) Heat map diagram of log2 (FPKM) values for genes annotated as ethylene, brassinolide, jasmonic acid, abscisic acid and wound induction metabolism and signaling pathway genes. (B) Relative expression of ethylene-, brassinolide-, jasmonic acid-, abscisic acid-, and wound-induction-related genes as determined by RT-qPCR. Different letters above the bars indicate a statistically significant difference. Values represent means ± SE (n = 3).

