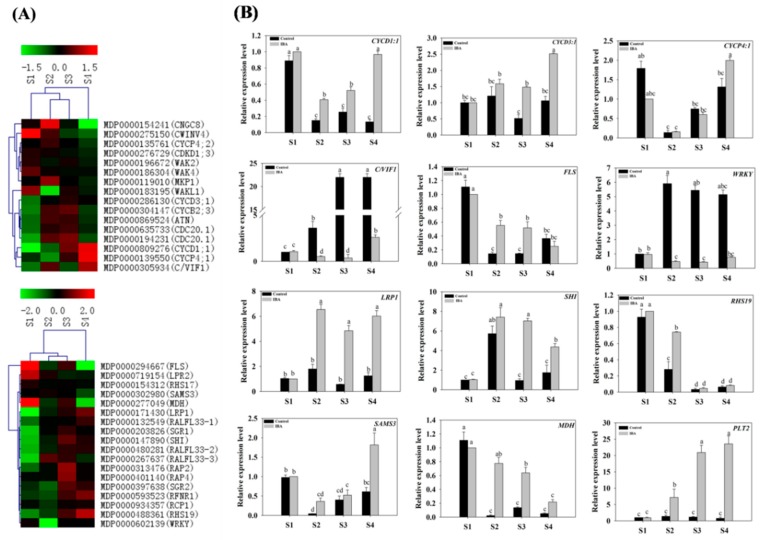
Figure 9.
Expression profiles of root development-, cell cycle-, and enzyme- related genes in stem cuttings of ‘T337’ apple rootstocks during AR formation. (A) Heat map diagram of log2 (FPKM) values for genes annotated as root development-, cell cycle-, and enzyme-related genes. (B) Relative expression of root development-, cell cycle-, and enzyme-related genes as determined by RT-qPCR. Different letters above the bars indicate a statistically significant difference. Values represent means ± SE (n = 3).

