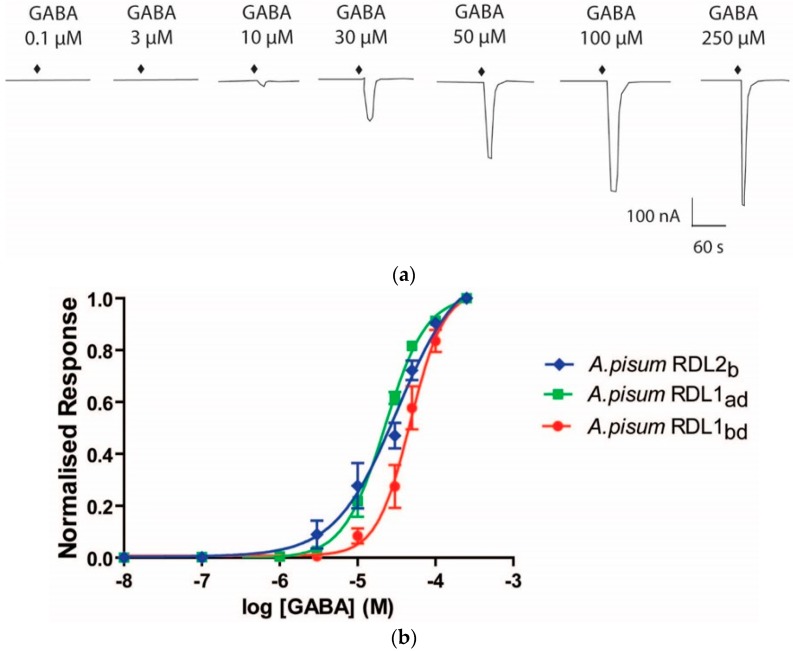
Figure 5.
Responses to GABA in X. laevis oocytes expressing Apisum RDL. (a) Representative current trace of a GABA concentration response curve showing responses to GABA from 0.1–250 μM for Apisum RDL1bd; (b) GABA concentration response curves obtained for Apisum RDL1ad, Apisum RDL1bd, and Apisum RDL2b variant 1. Data were normalised to the maximal response (250 μM). Data is the mean ± SEM from n = 4–5 oocytes from ≥ 3 different frogs.

