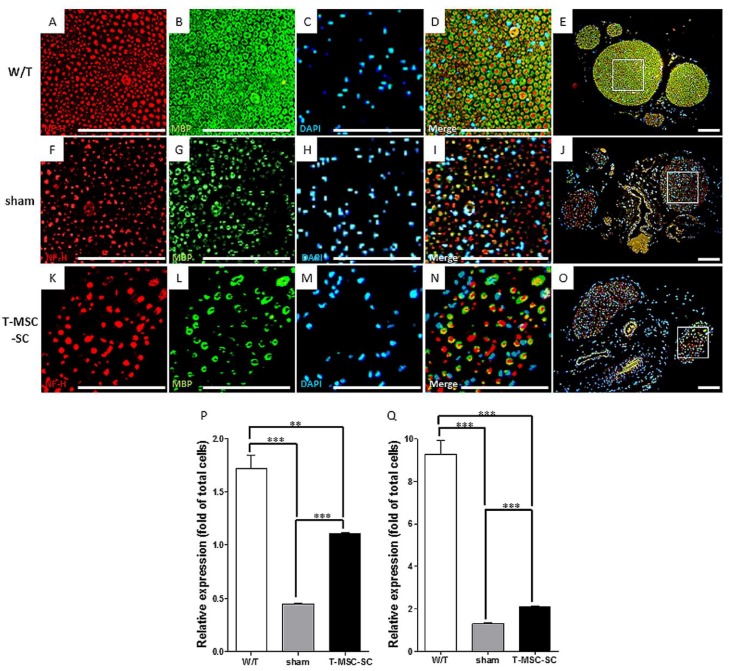
Figure 6.
Remyelination and sciatic nerve regeneration by T-MSC-SCs transplanted into Tr-J mice. T-MSC-SC (K–O) or control (phosphate-buffered saline (PBS)) alone (sham; F–J) were injected into the thigh muscle. Age-matched W/T animals (A–E) were used as normal controls. The biopsy specimens obtained at 12 weeks after injection. Representative images of the sciatic nerve regeneration showing neurofilament-H (NF-H; red) and the remyelination showing myelin basic protein (MBP; green), and DAPI (blue) staining on a sciatic nerve cross-section from the W/T, sham, and TMSC-SC groups. Boxed areas in E, J, and O are enlarged in D, I, and N, respectively. Scale bars = 100 μm. Fluorescence intensities were quantified using ImageJ software (P, NF-H; Q, MBP). Data are the means ± SEM of experiments performed in triplicate. ** p < 0.01, *** p < 0.001.

