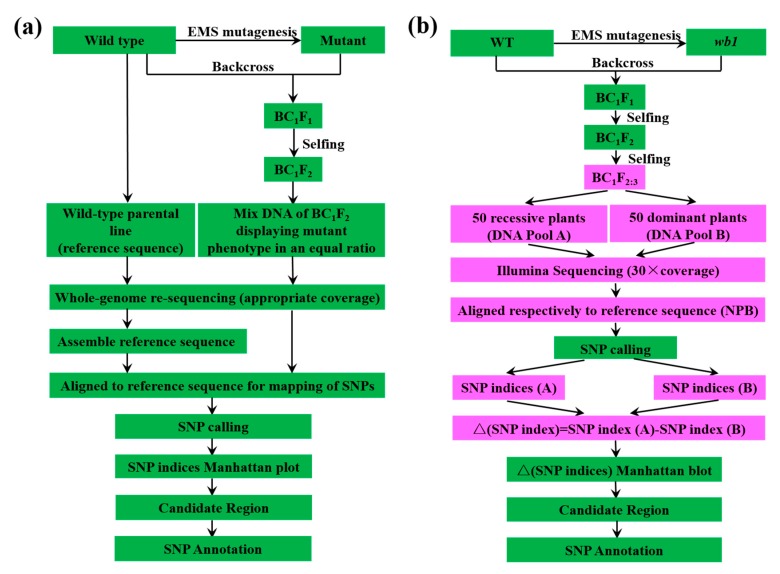
Figure 1.
The steps of MutMap method applied to rice. (a) Common scheme of MutMap method applied to rice following the protocol described as previously reported [33]; (b) The scheme of gene mapping used in this study. The BC1F2:3 progeny formed mapping population. DNA of 50 recessive and 50 dominant plants from mapping population are mixed separately in an equal ratio to form the DNA Pool (A) and Pool (B) followed by the construction of DNA library and Illumina sequencing with 30×coverage, and then the treated sequencing data were aligned with the reference sequence followed by single nucleotide polymorphisms (SNP) calling. The reference sequence is the publicly available Nipponbare rice genome sequence [37]. For each identified SNP, SNP index (A) was obtained from Pool (A) and SNP index (B) corresponds with Pool (B). SNP index (A) minus SNP index (B) is ∆ (SNP index) which is used for Manhattan plot, and we can obtain candidate region followed by SNP annotation. The pink color represents the different steps compared to the common scheme of MutMap. EMS: Ethane methyl sulfonate.

