Figure 2.
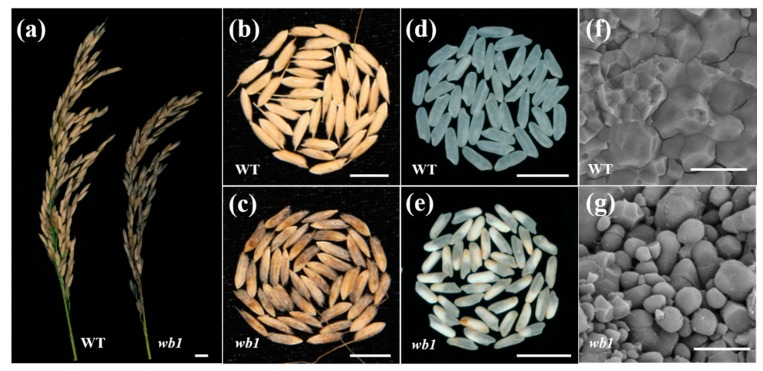
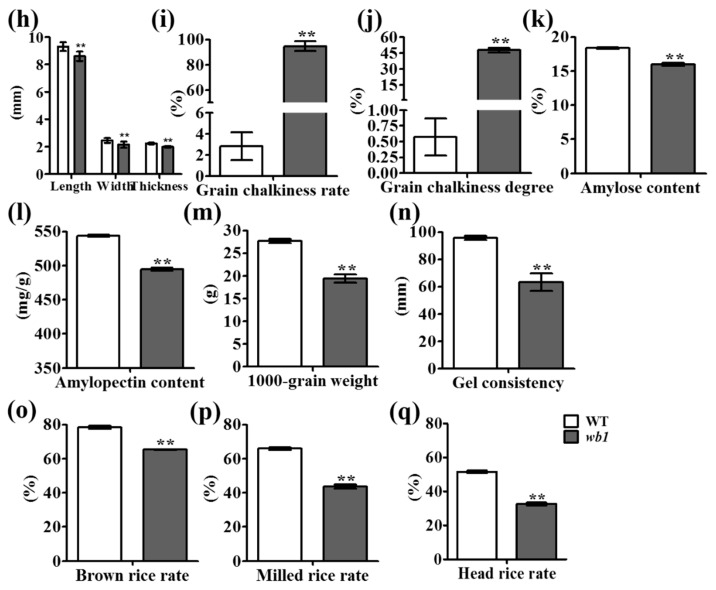
Phenotypic analyses of wb1. (a) Comparison of representative WT and wb1 plant panicles; (b,c) Appearance of WT (b) and wb1 (c) grains; (d,e) Appearance of WT (d) and wb1 (e) white grains; (f,g) Scanning electron microscope images of WT (f) and wb1 (g) seed endosperm. Magnification, ×2000; (h) Measurements of seed length, width, and thickness of WT and wb1 grains (n = 20); (i) Grain chalkiness rate comparison of WT and wb1 grains (n = 6), and grain chalkiness rate is the rate of chalky grains in total grains; (j) Grain chalkiness degree comparison of WT and wb1 grains (n = 6), and grain chalkiness degree is the grain chalkiness rate multiplied by grain chalkiness area (the percent area of chalk in a grain); (k) Amylose content comparison of WT and wb1 grains (0.05 g grain powder each, n = 3); (l) Amylopectin content comparison of WT and wb1 grains (0.01 g grain powder each, n = 3); (m) Comparison of 1000-grain weight of WT and wb1 (n = 10); (n) Gel consistency comparison of WT and wb1 grains (n = 4); (o,p,q) Comparisons of brown rice, milled rice and head rice rates of WT and wb1 (25 g paddy each, n = 3). Data are given as means ± SD (standard deviation). The asterisks represent statistical significance between WT and wb1, determined by a student’s t-test (** p ≤ 0.01). Scale bars: (a–e) 10 mm; (f,g) 30 μm.


