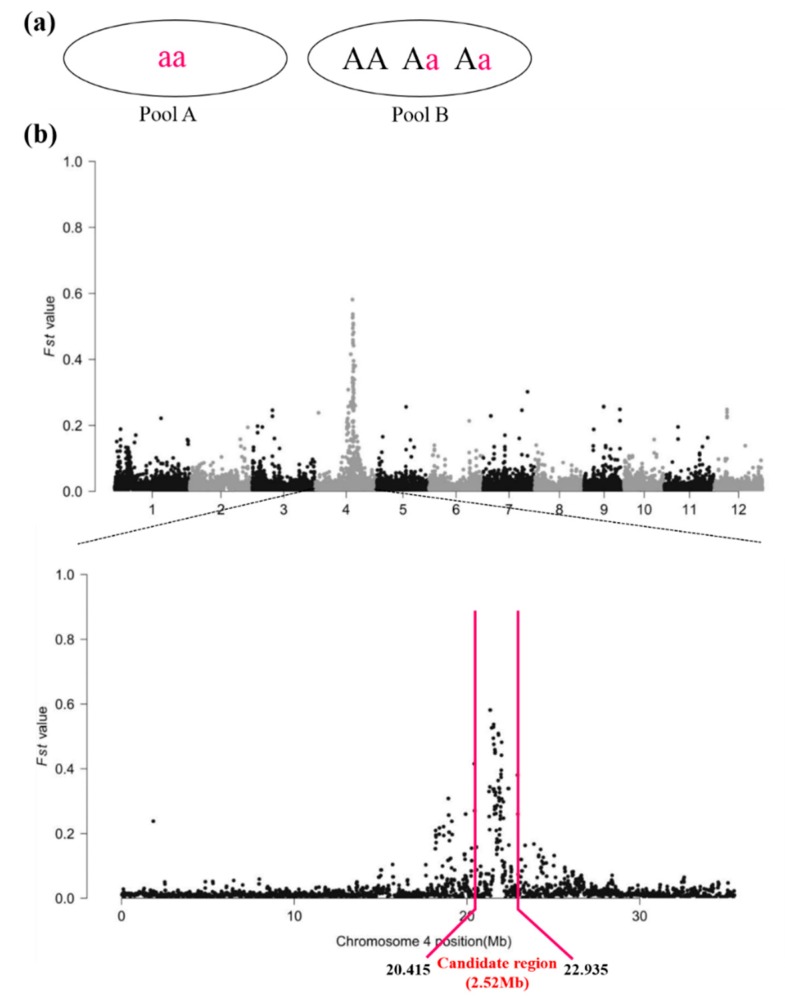
Figure 3.
Candidate region of wb1 obtained by the modified MutMap method. (a) An example for explanation of ∆ (SNP index) for the casual SNP. Theoretically, SNP index (A) would be 1, SNP index (B) 0.333 (1/3), and thus ∆ (SNP index) would be 0.667 (1 minus 1/3); (b) ∆ (SNP indices) Manhattan plot. Fst value, defined as the proportion of genetic diversity due to allele frequency differences among populations described by the previous report [38]. ∆ (SNP indices) and Fst values have the same meaning in this study.

