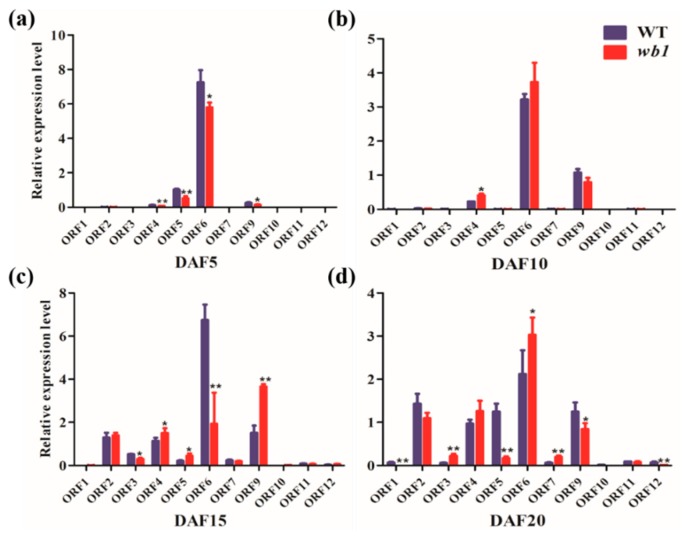
Figure 4.
Relative expression analysis of 11 candidate genes based on real-time quantitative PCR (qPCR) at four stages of endosperm development between WT and wb1. (a) Relative expression analysis of 11 candidate genes at DAF5 stage; (b) Relative expression analysis of 11 candidate genes at DAF10 stage; (c) Relative expression analysis of 11 candidate genes at DAF15 stage; (d) Relative expression analysis of 11 candidate genes at DAF20 stage. All data were compared with transcript levels of WT by Student’s t-test (* p ≤ 0.05, ** p ≤ 0.01). Values were means ± SD (n = 3).

