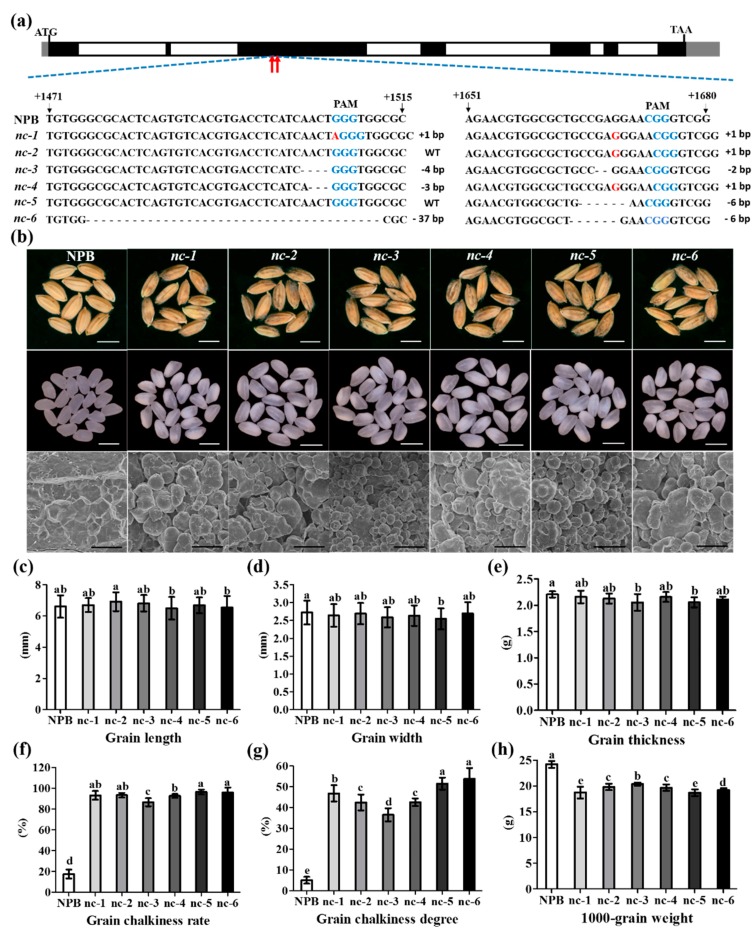
Figure 6.
Sequencing validation and phenotypic analyses of six novel allelic mutants. (a) Sequencing validation of six novel allelic mutants. Blue color represents the PAM sequence of CRISPR/Cas9 system; red color represents insert bases; “-” represents deletion bases; the red arrows indicate the mutant sites mediated by CRISPR/Cas9 system. (b) Appearance and SEM of NPB and mutants grains. Magnification, ×1000; (c–h) Measurements of grain length (n = 30), width (n = 30), thickness (n = 10), grain chalkiness rate (n = 10), grain chalkiness degree (n = 10) and 1000-grain weight (n = 10) of NPB and mutant lines. Different letters indicate the statistical difference at p ≤ 0.05 by Duncan’s test. Values were means ± SD. Scale bars: bars of grains figures 5 mm; bars of SEM figures 10 μm.

