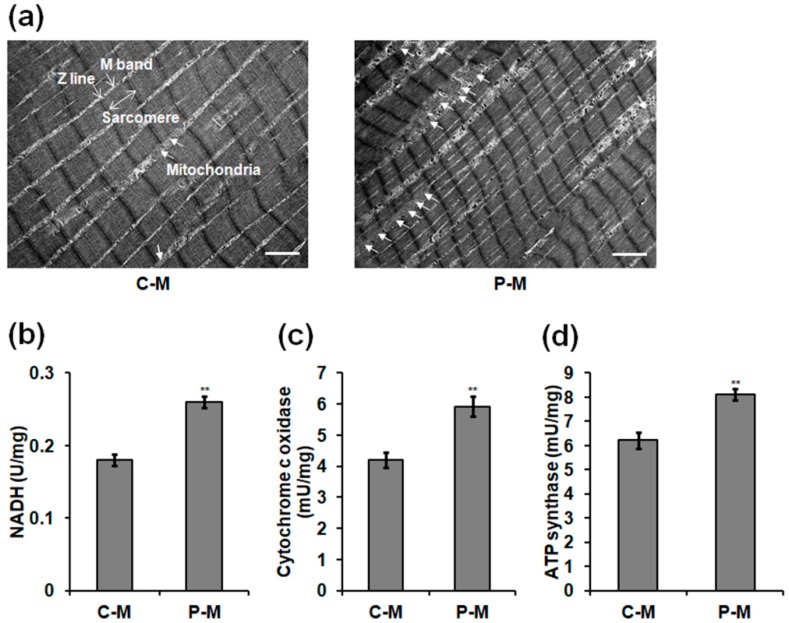
Figure 5.
Ultrastructure of skeletal muscles and mitochondrial respiratory enzyme levels in 90-day-old male chickens. (a) Representative longitudinal section of skeletal muscles. Z line, M band, and sarcomere in the myofibril are clearly observed. Mitochondria located between myofibrils are photographed using a transmission electron microscopy. The arrow shows the mitochondrion. Scale bar: 2.0 μm. (b) Nicotinamide adenine dinucleotide hydrogen (NADH) levels in the mitochondria of skeletal muscles. Activities of mitochondrial respiratory enzyme (c) cytochrome c oxidase and (d) ATPase synthase in skeletal muscles. Data are presented as mean ± SD (n = 10) of three replicates; n represents an individual chicken. **, p < 0.01 versus control, according to the one-way ANOVA with an LSD test.

