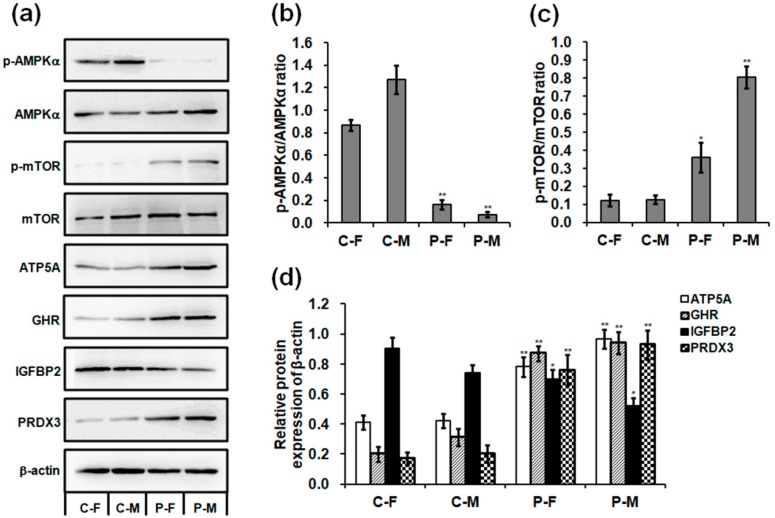
Figure 7.
Effect of plasma on protein expression in 90-day-old chickens. (a) Western blot analysis of protein bands in the skeletal muscles. Uncropped immunoblot scans are presented in Figure S1. Relative protein levels of (b) p-AMPKα/AMPKα, (c) p-mTOR/mTOR, and (d) ATP5A, GHR, IGFBP2, and PRDX3. Data are presented as mean ± SD (n = 3) of three replicates; n represents an individual chicken. *, p < 0.05 versus control; **, p < 0.01 versus control in females and males, respectively, according to the one-way ANOVA with an LSD test.

