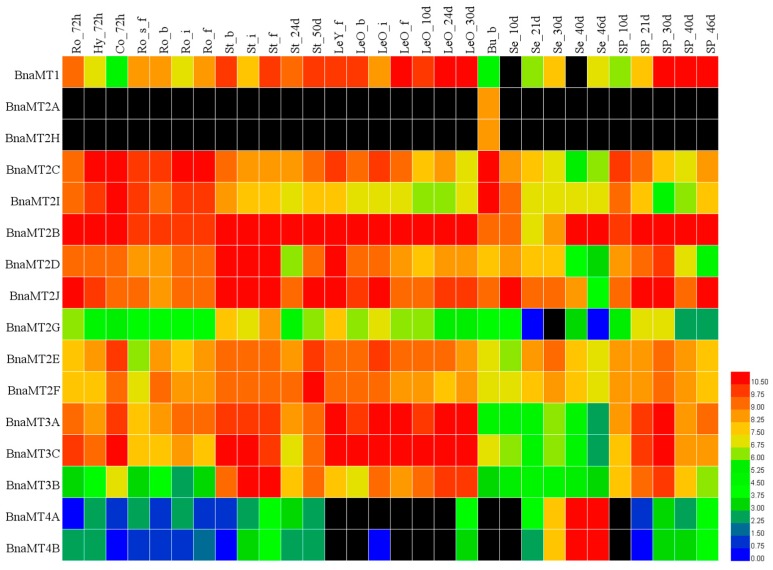
Figure 6.
Heatmap of the expression profiles of BnaMT family genes in different tissues and organs. The abbreviations above the heatmap indicate the different tissues and organs/developmental stages of B. napus ZS11 (listed in Table S1). The expression data was gained from the RNA-seq data and shown as log2, as calculated by fragments per kilo base of exon model permillion (FPKM) values. Black boxes indicate that no expression was detected by RNA-seq analysis. The heatmap was generated using Heatmap Illustrator v1.0 (HemI v1.0, Huazhong University, Wuhan, China; http://hemi.biocuckoo.org/contact.php).

