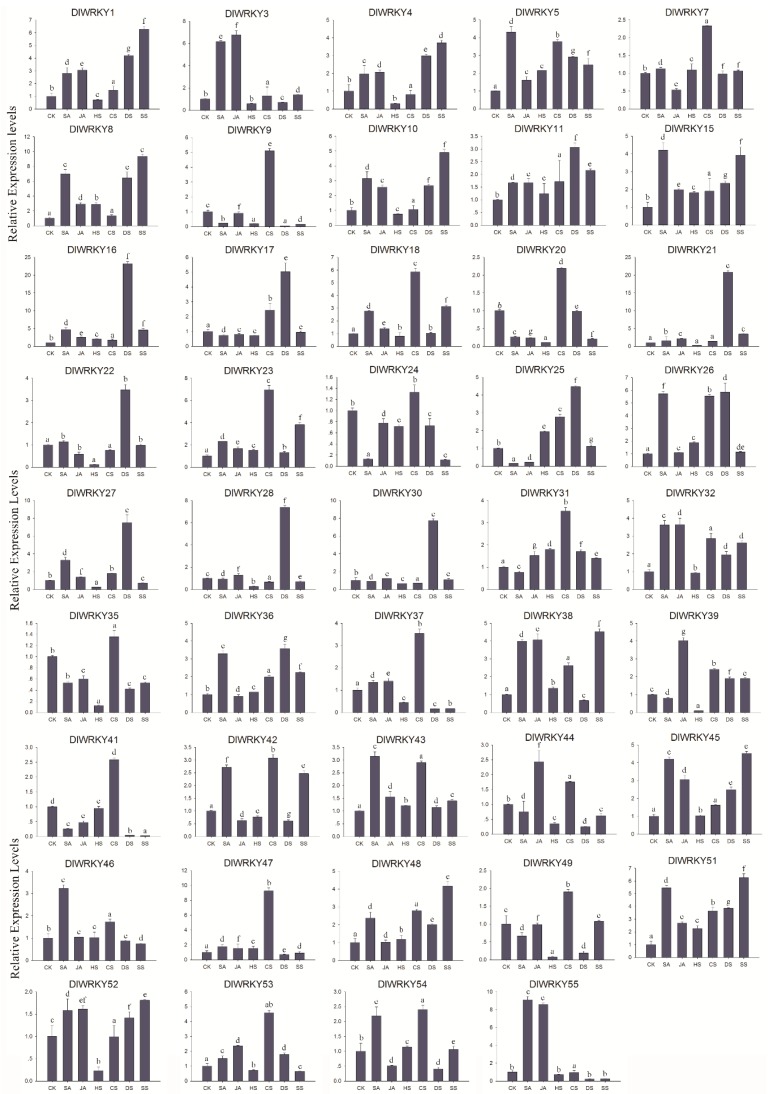
Figure 6.
The expression patterns of the selected DlWRKY genes under various hormonal and abiotic stresses. The x-axis indicates various treatments and the y-axis indicates the relative expression level. Error bars were obtained from three independent biological replicates. Values with the same letter were not significantly different when assessed using Duncan’s multiple range test (p < 0.05, n = 3). SA represents salicylic acid, JA represents jasmonic acid, HS represents heat stress, CS represents cold stress, DS represents drought stress, and SS represents salinity stress.

