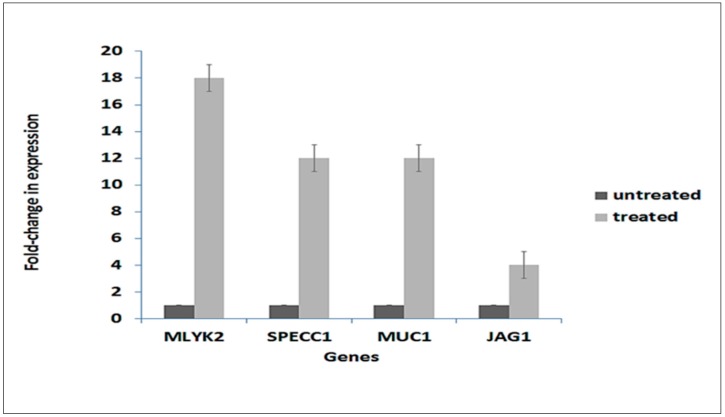
Figure 9.
qPCR validation of expression of selected genes from transcriptome analysis data. One gene from each gene group in Figure 8 was selected. Their expression was determined by qPCR according to the 2−ΔΔCt method using RPL13A as an internal control [14]. Expression of each gene was normalized to the expression level of the gene in untreated cells, which was assigned a value of 1. Data represent the average of three independent experiments ± SD. Each independent experiment comprised three biological replicates. Untreated, control cells; Treated, 4.5 h after exposure of cells to A. graveolens extract.

