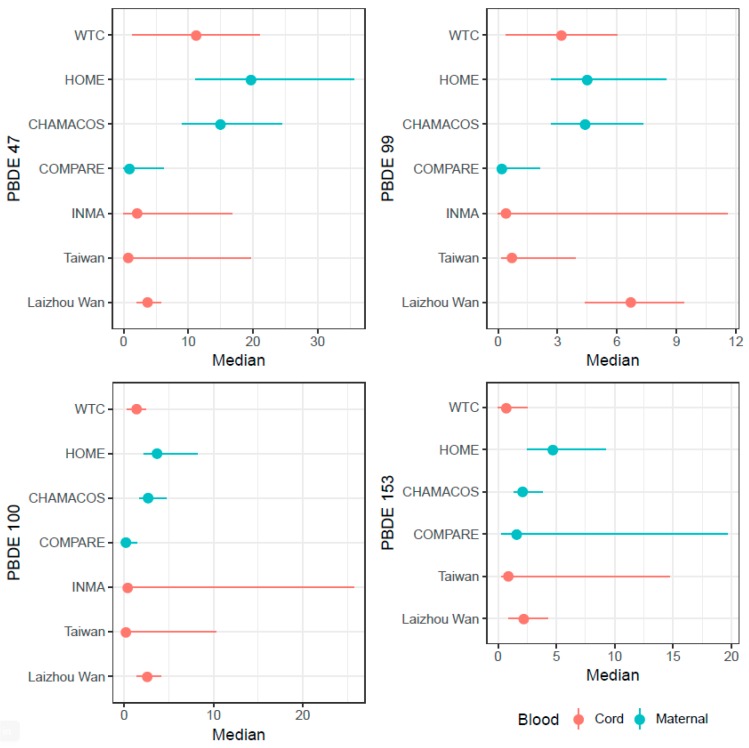
Figure 2.
PBDE concentrations of BDE-47, -99, -100, and -153 across cohorts. 1. Points represent PBDE concentration medians. Ranges represent 25th to 75th percentiles for World Trade Center (WTC), Health Outcomes and Measurements of the Environment Study (HOME), Center for the Health Assessment of Mothers and Children of Salina (CHAMACOS), and the Chinese (Laizhou Wan) cohort. Ranges represent minimum and maximum for the Taiwanese and Spanish (INMA) cohorts.

