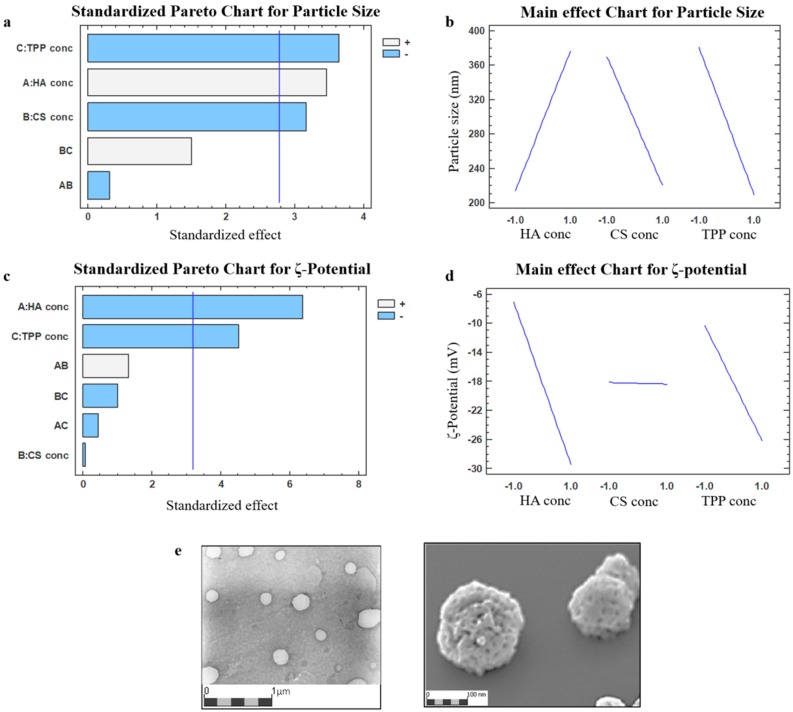
Figure 1.
Pareto chart and main effect chart depicting the impacts by individual factors or two-factors interaction on nanoparticles (NPs) size (a,b, respectively) and ζ potential (c,d, respectively) in the two-level full factorial screening; (e) TEM (transmission electron microscope) and SEM (scanning electron microscope) photomicrographs of the hyaluronic acid (HA)/chitosan (CS)-pentasodium tripolyphosphate (TPP) NPs (DoE batch #B).

