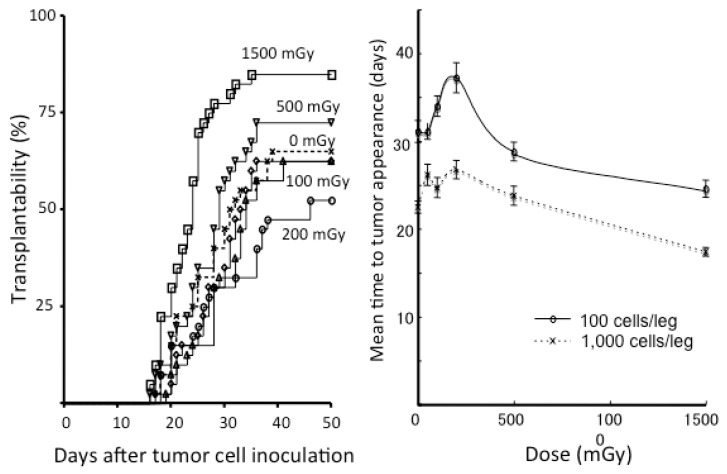
Figure 3.
Left panel: Tumor transplantability curves for EMT6 tumors in Balb/c mice receiving 0 to 1500 mGy of whole-body irradiation given 6 h before inoculation of 100 EMT6 cells. Each group consisted of 40 inoculation sites. Right panel: Mean time to tumor appearance in Balb/c mice developing EMT6 tumors as a function of the whole-body dose. Bars represent SE. In the groups inoculated with 1000 EMT6 cells, the differences were significant between the sham-irradiated group and the groups receiving 100, 200, or 1500 mGy (all p < 0.005). In the groups inoculated with 100 EMT6 cells, significant differences were seen between the sham-irradiated group and the groups receiving 200 or 1500 mGy (both p < 0.01). Modified from Reference [51].

